Trump failed to close the deal within his party on time for the planned Thursday healthcare vote inspite of much wheeling and dealing with Republican lawmakers . The vote has been seen by financial markets as a crucial test of Trump's ability to work with Congress to deliver on his other priorities, such as tax cuts and infrastructure spending.
Even if their replacement plan does eventually get approval from the House, the legislation faces a potentially tough fight in the Republican-controlled Senate.
The House and Senate had hoped to deliver a new healthcare bill to Trump by April 10, when Congress is scheduled to begin a two-week spring break. The deal needs to be approved before Congress go for their long break. Trump appears to understand this which is why he conducted closed-door meeting with
House of Representatives Republicans on Tuesday and Wednesay to lobby support for the Healthcare reform bill in order to avoid a significant delay in implementing tax reform.
For the the short term, the markets is concerned whether the Trump administration’s tax cutting plans get delayed . If the Healthcare reform bill is delayed beyond 10 April, the market could sell down in view of the delay in tax reform.
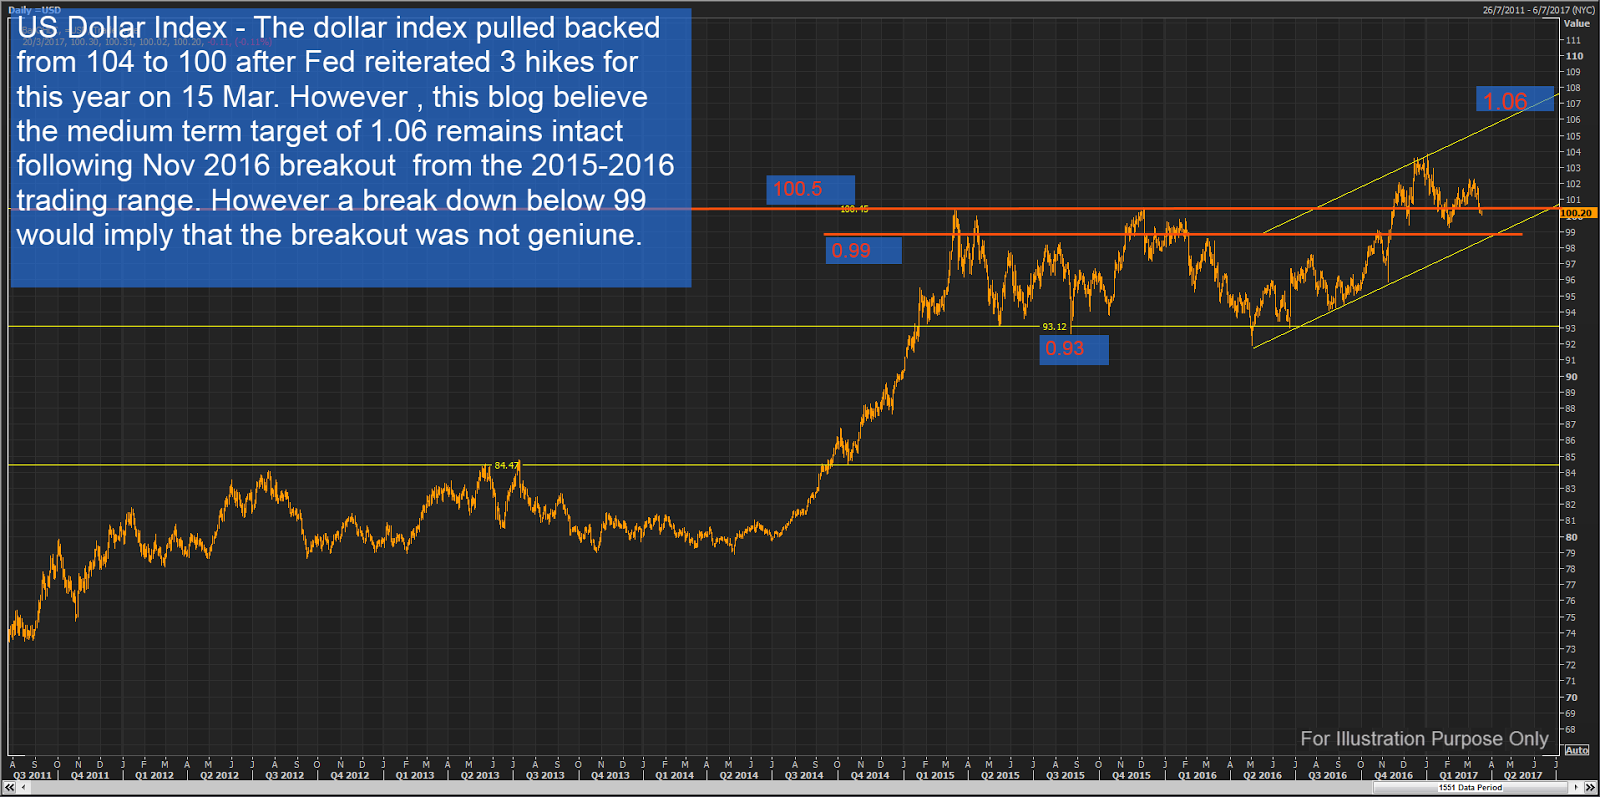
All posts and charts are for educational and illustration purposes only