Showing posts with label S&P500. Show all posts
Tuesday, December 3, 2019

S&P 500 - Flashing Red

S&P 500 could have topped out and could be heading for a huge correction.


All posts and charts are for educational and illustration purposes only
Tuesday, July 9, 2019

S&P 500 - topping out

S&P 500 is forming a topping out pattern, which could lead to significant decline.


All posts and charts are for educational and illustration purposes only
Friday, December 28, 2018

S&P 500 - 3.56% Potential Intraday Return

S&P 500 briefly touched our RHO Intermediate Day Low last night and rebounded 85 points, 3.56% potential gain in the same day! Congrats to subscribers who traded based on the signal!


All posts and charts are for educational and illustration purposes only
Wednesday, December 26, 2018

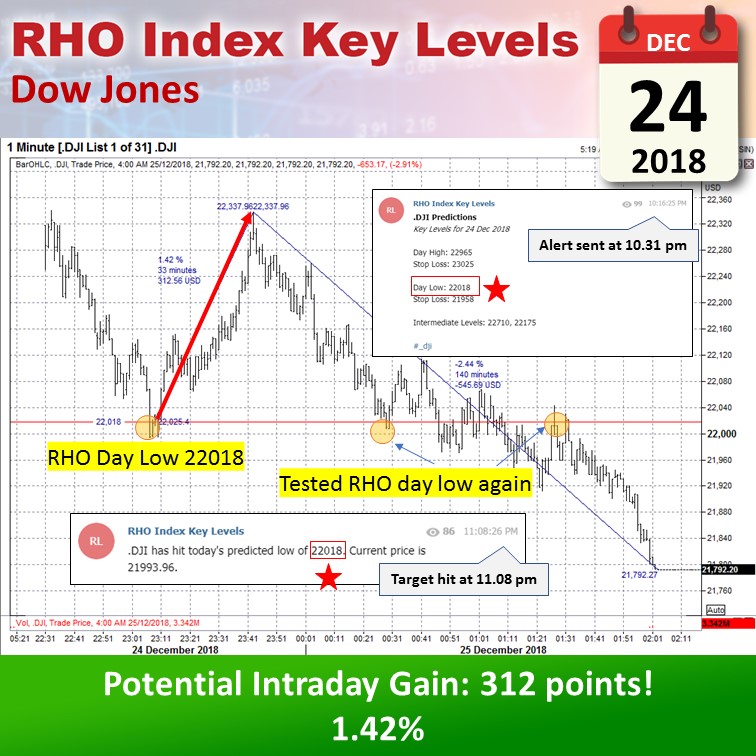
Long Dow and S&P on a bearish trading day? Quick intraday trade with RHO Index Key Levels!

Dow Jones hit the predicted day low on Christmas Eve and rebounded 312 points! Even on a bearish trading day, the RHO strategy managed to give a good return for a long trade, before it fell 545 points to close at day low. The RHO predicted day low was tested a few more times, which shows that it is indeed a significant level.


On Christmas Eve, the S&P 500 hit RHO predicted day low at the same time as Dow Jones! Similarly, it managed to rebound  38 points (1.42%) in the same day, before falling 58 points (2.41%) to close at day low. With the RHO Index Key Level strategy, you will have more trading opportunities at high probability levels, whether in a bull or bear market!

Sign up for one month free trial here!


All posts and charts are for educational and illustration purposes only