Showing posts with label Dow Jones. Show all posts
Friday, June 26, 2020

Dow Jones Short Term Price Action

Dow Jones - Risk remains on the downside. The index tested 26304 multiple times but failed to break above. The short term upside is capped by 26304 resistance and the downtrend line. Turn bullish only when price is able to hold above 26304 level. The index should retest the 25000 level again. A break below 25000 could bring the index to 24655 and 24243.


All posts and charts are for educational and illustration purposes only
Thursday, June 11, 2020

Dow Jones Futures - First Break Down in 1.5 Months

Dow Jones Futures breaks down from the uptrend channel for the first time in 1.5 months. Standby for more weakness ahead.


All posts and charts are for educational and illustration purposes only
Friday, May 15, 2020

Intra-Day Trading with Pin Point Precision

Dow Jones gave traders a roller coaster ride yesterday, With dismal employment data and US China trade tension casting doubts on the recovery, at one point it had fallen 1500 points from previous day's peak. We predicted the day low 22800 before the market opened, and we saw the index free falling right from the opening bell and rebounded sharply at our predicted level to stage a 1400 points come back!

To experience systematic trading with pin point precision, check out our RHO Index Key Levels signal www.tradingkungfu.com/keylevels.


All posts and charts are for educational and illustration purposes only
Wednesday, April 8, 2020

Simple Support and Resistances strategy that works in any time frame!

Yesterday Dow Jones went thru a roller coaster swing going up by nearly 1000 points and gave away all the gains by market close, but last yesterday's price action established key support and resistance on the 1 min chart that i used could still use during the Asia trading hours to make some profit .

Key support and resistance levels were 22,826 and 22630. Sometimes trading can be simple only if we know how to look out for keys.


All posts and charts are for educational and illustration purposes only
Saturday, March 14, 2020

More Upside Next Week After Wall Street Staged Its Biggest Rebound Since 2008?

More Upside Next Week After Wall Street Staged Its Biggest Rebound Since 2008?
Previous Price Action Don't Look Too Promising !

Since 2 to 11 Mar Dow Jones Index have failed after every rebound without a follow through buying and in fact prices got lower subsequently .

Donald may have chosen to declare national emergency to combat the Covid 19  just 30 minutes before the market close to catch the short sellers . He also caught the market by surprise by directing the US Energy Dept to purchase crude oil for the strategic petroleum reserves . The announcement triggered a wave to program short covering that lasted until  the closing bell. Chances are short covering rebound do not last very long.  

All posts and charts are for educational and illustration purposes only
Monday, June 10, 2019

Dow Jones - Key Resistance at 26090

Dow Jones had one of its best rebound this year, rebounding 1200 points over the last 4 days. According to this trade plan, the key resistance stands at 1600. A pullback to 25620 and 25450 in the short term is expected.


All posts and charts are for educational and illustration purposes only
Monday, April 22, 2019

Dow Jones - Dow Jones - A Head And Shoulder Reversal Pattern In The Making?

Dow Jones - A Head And Shoulder Reversal Pattern In The Making?

All posts and charts are for educational and illustration purposes only
Friday, February 1, 2019

Dow - Testing Overhead 200 Days Resistance and RHO Trendline

DOW Tradeplan  - Dow is currently testing the overhead  200 days MA and the RHO Trendline resistance. This Blog expect the current counter trend rally to run out of steam soon , a break a below 247760 will take the index to 24310 , 23180 and 22625 . Its worth noting the volume traded on 31 Jan was the highest in January , an indication the index could pull back soon.

All posts and charts are for educational and illustration purposes only
Friday, December 28, 2018

Dow Jones - 1080 points potential gain with RHO Strategy

Dow Jones hit our RHO Intermediate Day Low at 11.32pm, shortly after the market opened and rebounded 317 points. It went on to test the RHO Intermediate Day Low again, before breaking out at 3.41am for a 763 points rally! Total potential intraday gain 1080 points, 4.83%!


All posts and charts are for educational and illustration purposes only

518 points from short trades when Dow Jones had its biggest points gain in history!

It was a bullish trading day on 26 Dec after the Christmas Holiday. Dow Jones recorded its biggest points gain in history, with a 1158 points rally at the stroke of midnight. 

However, though it did not hit our predicted day low, our RHO Index Key Levels strategy still managed to yield good returns on the corrections. A short trade at RHO intermediate day high at 12.57am could have yielded 352 points, and a short trade at RHO day high at 1.57am could have yielded 166 points. I am glad that the RHO day high was tested again at 3.27 am before the final 558 points rally. This shows that the RHO predicted levels were indeed significant levels.


All posts and charts are for educational and illustration purposes only
Wednesday, December 26, 2018

Long Dow and S&P on a bearish trading day? Quick intraday trade with RHO Index Key Levels!

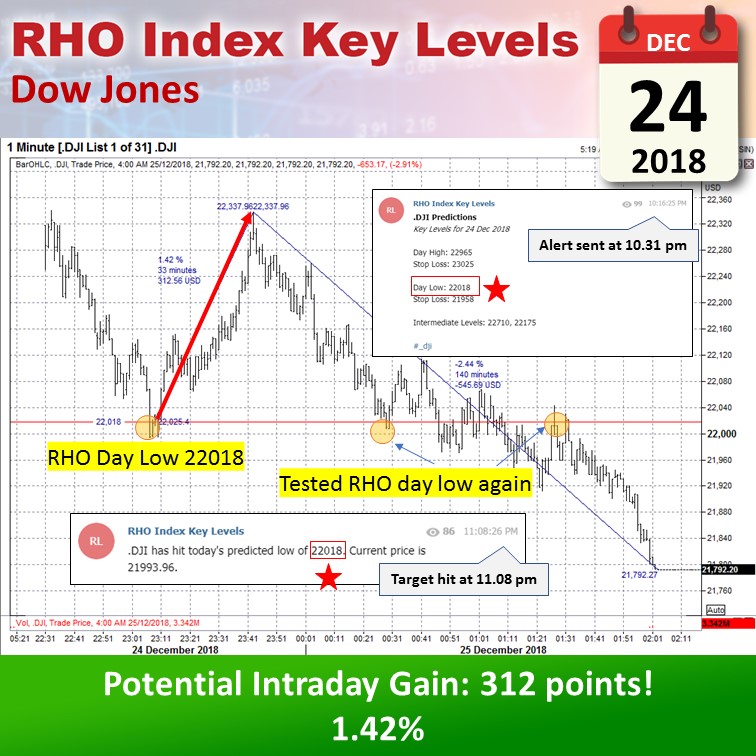
Dow Jones hit the predicted day low on Christmas Eve and rebounded 312 points! Even on a bearish trading day, the RHO strategy managed to give a good return for a long trade, before it fell 545 points to close at day low. The RHO predicted day low was tested a few more times, which shows that it is indeed a significant level.


On Christmas Eve, the S&P 500 hit RHO predicted day low at the same time as Dow Jones! Similarly, it managed to rebound  38 points (1.42%) in the same day, before falling 58 points (2.41%) to close at day low. With the RHO Index Key Level strategy, you will have more trading opportunities at high probability levels, whether in a bull or bear market!

Sign up for one month free trial here!


All posts and charts are for educational and illustration purposes only
Monday, December 24, 2018

Dow Jones - the bottom is still way off

Volume traded on Dow Jones on 21 December was the highest in the last 5 years. It is the first sign of PANIC. We could see some short covering but the bottom is still way off!


All posts and charts are for educational and illustration purposes only
Friday, December 21, 2018

Dow Jones - Broke Below Crucial Support at 23333

Dow Jones broke below 1 year consolidation range and last strong support at 23333.


All posts and charts are for educational and illustration purposes only
Thursday, December 20, 2018

Predicted Dow Jones day high within 2 points, 3.72% in an hour!

Dow Jones had a wildly volatile trading session last night, with an intraday range of almost 700 points. Our RHO Index Key Level prediction managed to call the day high within 2 points, and it subsequently fell 694 points, giving a potential gain of 3.72% in an hour! The intermediate day high was also tested a few times, as highlighted in the chart below, which validated that it was indeed a key level. 

Congratulations to subscribers who benefited from the signal last night! 


Also Claim your one month free trial and join other subscribers who have been benefiting from RHO Index Key Levels every day.


All posts and charts are for educational and illustration purposes only
Wednesday, July 4, 2018

Dow Jones - RHO Key Levels Prediction on 3 July 18

Last night's RHO Key Levels projection for Dow Jones was spot on! From the charts, you can see it consolidated around the projected day high before plunging 275 points in 3 hours.


To get 3 months free subscription of the RHO Key Levels on your mobile phone, sign up for our DLC interest group, and we will send you the special promo code. You will also enjoy various benefits and get invited to exclusive events!

More details and registration on the Trading Kungfu website:


All posts and charts are for educational and illustration purposes only
Tuesday, May 8, 2018

Dow Jones - The Fight Is On!

DOW - The Bull and Bear In Trench Warfare

The Bull and Bears have been engaging  in a battle for control in the traingular arena. The Dow has rebounded from the ascending trendline numerous time since Feb 18, staying above the 200 days MA. The direction it breaks will set the tone for the next major move, Traders are better off not trying to impose thier view on the market, listen carefully to what the price action tell you and wait patiently for the break. This blog has been calling for the end of the bull market since Feb and naturally expects the Dow to break to the downside . A break below this ascending triangle could be long term bearish and could drive it to its next immediate support at 22650
All posts and charts are for educational and illustration purposes only
Sunday, April 8, 2018

Dow Jones - Why I would be concern if it falls below the 200 Days Moving Average !

The 200 Days Moving  Average is considered a key indicator by traders and market analysts for determining the overall long term trend. The Dow has not broken the 100 days MA since 10 Nov 2016 and the 200 day MA since 16 Mar 2015. The last time Dow broke the 200 Days MA was on 20 Aug 2015 and 6 Jan 2016 and on both it loss 10 percent . The Dow chart has not look this bearish for a long time falling from Jan  high of 26600 to Feb low of  23290. The current obvious price action of consecutive swing points registering lower lows are indications of more weakness ahead. The current 20 Days MA sits on the 23476 level and if history repeats we could see a 10 percent drop to 21128. My charts are indicating the immediate support of the Dow at 23000 and 21680 respectively in the event the 200 Days MA is breached.
All posts and charts are for educational and illustration purposes only