Repealing Obamacare must be addressed before the senate can move on to address the Tax Reform which is believed to be Trumponomics best hope to raise GDP to 3% and to add the next leg of the current market rally. This blog believe that Trump administration will want to settle the healthcare issue before the Congressional August recess which begins on 31 July. The next bull leg will be determine by when the health care bill is addressed. Janet Yellen’s comment this week that asset valuations are “somewhat rich” reminds traders of
Alan Greenspan 1996 warning about “irrational exuberance” added to the current negative sentiments. The US market is showing sign of an imminent correction with selloff in tech stocks, these negative sentiments if extended to the broader market could spark a 15-20% correction on the market.
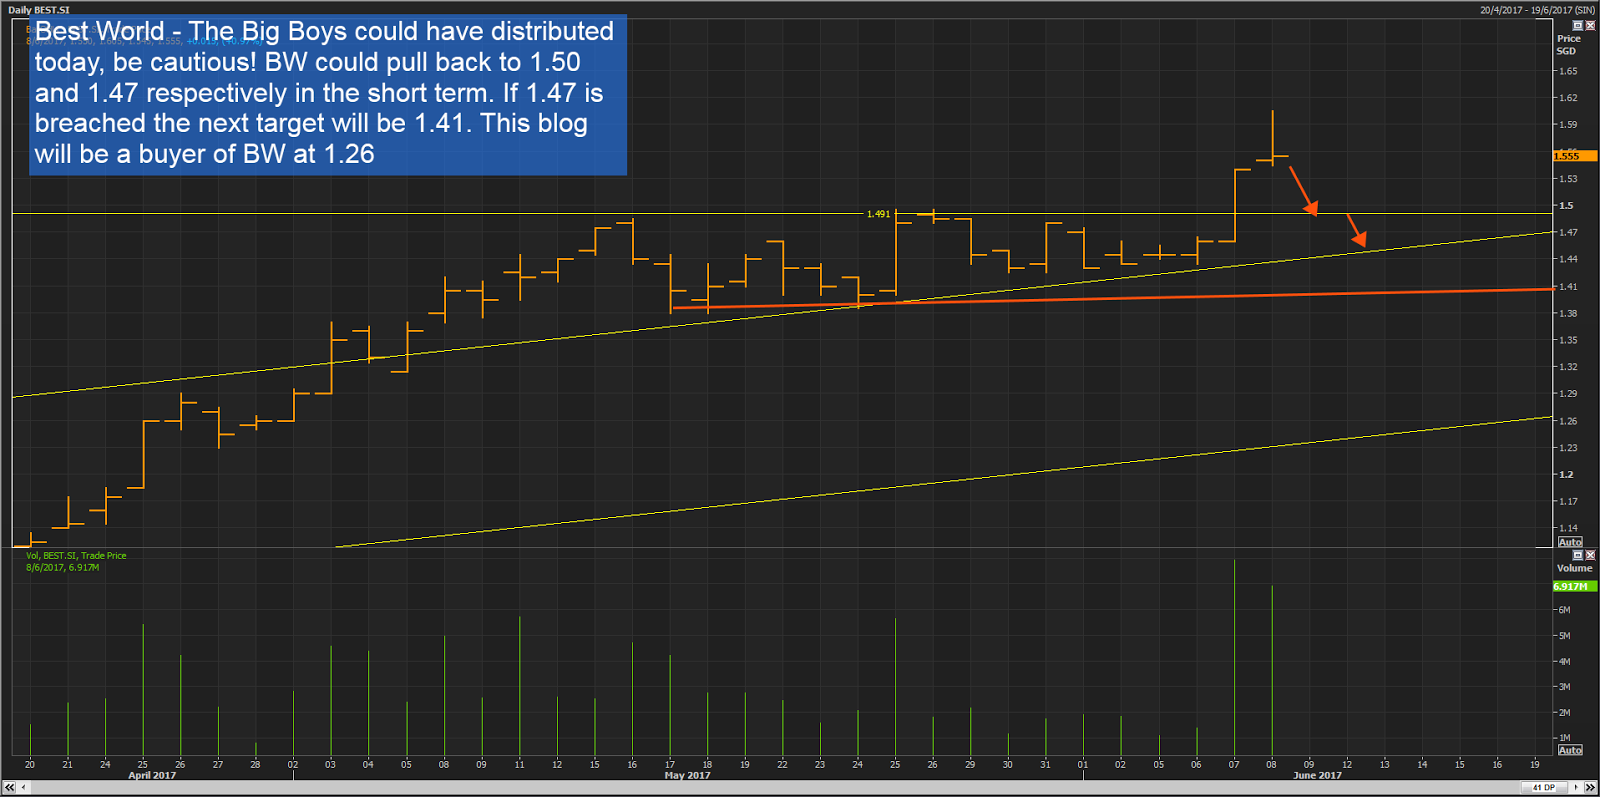
All posts and charts are for educational and illustration purposes only