Tuesday, September 29, 2020


Cosco Shipping (SGX: F83) "Every Dog Has Its Day"

Cosco Shipping Spore - "Every Dog Has Its Day" ... this stock has not seen daylight since 2011. 

Today, the price action is unusual with significantly improved volume indicating positive energy is back after a long time. Watch for the break above the downtrend line. Upon a breakout, the price could accelerate towards 0.22 its first resistance and 0.25 if a bit of luck. A break below 0.178 will negate all positive price action.


All posts and charts are for educational and illustration purposes only
Thursday, September 24, 2020

Tesla Battery Day Hype Disappoint.


Tesla Battery Day Hype Disappoint.

Tesla unveiled its much anticipated in-house technology amidst high expectation on battery day only to disappoint as management expects to halve battery price and ramped up

US$25,000 passenger electric vehicle in 3 year's time. The market was expecting game changer technologies such as silicon nanowire or single cathode material but there was no surprises.

On the chart Tesla price could have peaked for now and could be heading for the 50 Days MA at 358 before heading south again for the 338 level. The first credible support at 296 will be my first target and if the market condition deteriorates it could head for 273 which is my conviction support level .


All posts and charts are for educational and illustration purposes only
Thursday, September 17, 2020

Major Wall Street Indices could correct further


Major Wall Indices could correct further.

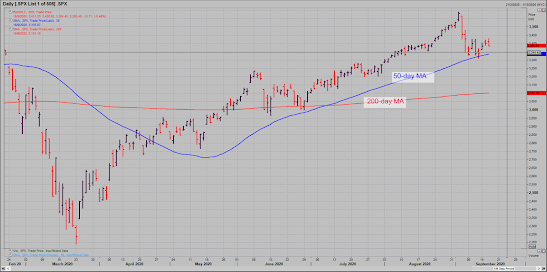
S&P 500/ Dow Jones/Nasdaq/ Russell 3000/Emerging Market Indices are trading close to its 50-day MA.

Will it break?

Normally, in an average bull market, investors should be buying when the asset class is supported above the 50-day MA as they  tend to rebound and go higher from this important technical level.

However, if you have watched my recent posting on how I called the Nasdaq top before its correction you will understand that the major Wall Street Indices have yet complete its corrective phase.

There could be more downside potential in the event that they break below their respective 50-day MA, they are likely to move towards their 200-day MA.

Nasdaq 100 Chart


Dow Jones Chart


 S&P 500 Chart


All posts and charts are for educational and illustration purposes only
Wednesday, September 16, 2020

Gold Is Taking A Breather

 Gold Is Taking A Breather

Fed promised to keep interest rates lower for longer, increased liquidity and its asset purchase policy to include corporate and municipal bonds have caused stocks  to skyrocketed to dot-com-bubble-like valuations.  And now, the Fed wants inflation to run higher to make up for lack of growth. ... Importantly, a lot of the first round of stimulus money – which started going out five months ago – still hasn't been spent yet and they are talking of more stimulus to come. Democrats and Republicans are to about to  approve another 500b to 1 trillion fiscal stimulus policy if the current  negotiation goes through.

More money printing as a form of payout will devalue the U.S. dollar and makes poor people poorer, whether they know it or not... leading to more calls for handouts.

That is why as far back as June 2019 , I have urged investors to own "hard assets" that will increase in relative value as the value of things priced in U.S. dollars goes down.

That concept is key to understanding how to protect your portfolio against inflation. Hard assets are things like gold, silver, property, art and cryptos.

The world only contains so much of these physical assets and when inflation is stoked by unlimited printing of fake money Gold and Gold companies will benefit.

Since hitting a new high of more than $2,070 per ounce in early August, the price of gold has retraced 10% and traded in a small range around $1,950 for the past month. It's trading up about 1% today, hovering around $1,965 per ounce as I write

When an asset retraced from high and consolidates within a 10% range it's a bullish signal. and that's exactly what gold is doing right now.

The dollar has been weak in recent months and if continues to go down it will be another catalyst for gold .

 Gold stock was one of the 5 stocks which Warren Buffet bought in recent filing.

Interestingly, Warren Buffet a long-time ‘critic’ of gold for having no utility, has invested in Barrick Gold (a gold mining company) this time around.

Here some reason Warren Buffet is invested in gold:

§   Gold serves as a defensive play

§  A safety hedge against the dollar in the event the dollar collapses.

Another reason behind Warren Buffet move could be that precious metals are known to do well during the very late stages of the market cycle often right before a market correction.

On the chart, Gold’s price action is bullish stay above is uptrend channel and supported by the 50 Days moving average

Gold is at an inflexion point , its worth keeping a close watch.


All posts and charts are for educational and illustration purposes only
Friday, September 11, 2020

Nasdaq 100 - Its Make or Break


The tech heavy Nasdaq index log its fastest move from record to correction in history . A correction  Is defined as a pullback that is 10% from the recent high. The question on everyone’s mind is “ is  this really the top for Nasdaq and  the Big Tech’s leadership of the US stock market, and the related unprecedented relative out performance of growth over value?

From my 30 years in the stock market  it certainly looks like one and the  recent events certainly fit the bill, be it stock splits by widely followed companies triggering euphoric retail-driven rallies (in this case Apple and Tesla) or the sudden exposure of  a so-called “Nasdaq whale”. The FAANG stock today make up of 25% of the S&P 500 market capitalisation. 

A week ago when Nasdaq 100 was trading near its all time high  I predicted Nasdaq 100 will take a correction to 11200 and that was exactly what happened when the index fell from its high from 12439 on 2 Sep to 11145 on 4 Sep.

Will this 10 % correction turn into a 20 % correction with is the definition for a bear market . Well , tonight could be the make or break according to my trade plan. A break below 11050 will could trigger more downside and if prices stay above 11200 the uptrend could  stay intact. 

 .

All posts and charts are for educational and illustration purposes only
Thursday, September 10, 2020

AEM (Fundamentals Remains Intact But The Price Action Is Signalling A Potential Correction)


AEM - Fundamentals remain intact but the price action is signalling a potential correction in the near term. The price currently sits of the uptrend line and the 50 Days MA. A break below these levels could trigger downside target to 3.45 and 3.01. 


All posts and charts are for educational and illustration purposes only