Showing posts with label Gold. Show all posts
Wednesday, September 16, 2020

Gold Is Taking A Breather

 Gold Is Taking A Breather

Fed promised to keep interest rates lower for longer, increased liquidity and its asset purchase policy to include corporate and municipal bonds have caused stocks  to skyrocketed to dot-com-bubble-like valuations.  And now, the Fed wants inflation to run higher to make up for lack of growth. ... Importantly, a lot of the first round of stimulus money – which started going out five months ago – still hasn't been spent yet and they are talking of more stimulus to come. Democrats and Republicans are to about to  approve another 500b to 1 trillion fiscal stimulus policy if the current  negotiation goes through.

More money printing as a form of payout will devalue the U.S. dollar and makes poor people poorer, whether they know it or not... leading to more calls for handouts.

That is why as far back as June 2019 , I have urged investors to own "hard assets" that will increase in relative value as the value of things priced in U.S. dollars goes down.

That concept is key to understanding how to protect your portfolio against inflation. Hard assets are things like gold, silver, property, art and cryptos.

The world only contains so much of these physical assets and when inflation is stoked by unlimited printing of fake money Gold and Gold companies will benefit.

Since hitting a new high of more than $2,070 per ounce in early August, the price of gold has retraced 10% and traded in a small range around $1,950 for the past month. It's trading up about 1% today, hovering around $1,965 per ounce as I write

When an asset retraced from high and consolidates within a 10% range it's a bullish signal. and that's exactly what gold is doing right now.

The dollar has been weak in recent months and if continues to go down it will be another catalyst for gold .

 Gold stock was one of the 5 stocks which Warren Buffet bought in recent filing.

Interestingly, Warren Buffet a long-time ‘critic’ of gold for having no utility, has invested in Barrick Gold (a gold mining company) this time around.

Here some reason Warren Buffet is invested in gold:

§   Gold serves as a defensive play

§  A safety hedge against the dollar in the event the dollar collapses.

Another reason behind Warren Buffet move could be that precious metals are known to do well during the very late stages of the market cycle often right before a market correction.

On the chart, Gold’s price action is bullish stay above is uptrend channel and supported by the 50 Days moving average

Gold is at an inflexion point , its worth keeping a close watch.


All posts and charts are for educational and illustration purposes only
Sunday, July 26, 2020

Gold, Precious Metals , Crypto’s and Dow’s Price Action


Gold, Precious Metals , Crypto’s and Dow’s  Price Action
Gold nearing all  time high , precious metal  and crypto’s breakout.  Spot Gold is approaching its all time high at 1920 (last done 1900) , silver  broke above the US$19.54-21.09 resistance with  Platinum and palladium joining the party . Crypto currencies in Ethereum and Bitcoin are breaking out too. On the equity front, The Dow last traded at 26469 could be weak in the short term , heading for its support at 26277 and 25748. Nasdaq last traded at 10483 could be poised to test its 10120 support .  Silver’s break above the US$19.54-21.09 resistance zone on Wednesday triggers the bullish implication of its 2015-2020 basing pattern. This breakout is equivalent to gold’s January 2019 breakout and supports an ultimate upside target for silver of US$31.80-32.00. In the short term, silver is in “overbought” territory so there are risks of a short-term pullback/correction. However, with both the daily and weekly momentum indicators confirming the breakout, short-term pullbacks should be seen as buying opportunities in anticipation of a move up to the US$31.65-32.10 area. The old resistance zone at US$19.54-21.09 is now seen as support. Looking at the silver/gold ratio this week’s surge in silver has the ratio breaking out of the 2012-2020 downtrend channel suggesting further outperformance in silver over gold For Crypto, Ethereum’s breakout last Wednesday from the June-July trading range targets US$217-248.00. This breakout in turn has confirmed a larger move from the 2019- 2020 consolidation pattern which supports a minimum upside target of US$365- US$400. While Bitcoin is lagging Ethereum the chart setup is similar. The breakout from the May-July consolidation pattern implies an initial upside target of US$12,200-12,500. 


All posts and charts are for educational and illustration purposes only
Thursday, April 23, 2020

Gold Trade Plan

Stock and commodity indices are rebounding since hitting the March low but guess which is the real market leader in relative performance ! It’s GOLD. For those who have been following me, I have been most bullish on Gold since Nov 2019 and I have been guiding my trading community on Gold’s Price Action. I posted a trade plan of gold 2 weeks and it has worked perfectly. Watch this updated Gold tradeplan and it’s relative performance amongst all the major stock indices in the world like China a50, Hang Seng, Dow, Nasdaq and STI. The cards are laid , if you need to invest gold should be the choice.


All posts and charts are for educational and illustration purposes only
Tuesday, January 7, 2020

Gold - A New Bull Cycle Has Just Begun

Gold - When Gold broke above 1340 in Jun 19 , i declared a New Gold bull cycle has started . After Gold shot pass 1340 i predicted on my blog that it will hit a high of 1550 in Sep 19.  Yesterday Gold prices surpassed the target to close at a 6 years high of 1588. I believe the metal is  in the cusp of early New Bull cycle and there is more room to run. If Gold can stay above 1588, the next target will be 1654 and to complete this cycle the metal will have to achieve the 1704 target
All posts and charts are for educational and illustration purposes only
Tuesday, June 25, 2019

Four Signs the Gold Bull is Back

Gold break out of 6 years downtrend. I have called a buy on Gold since my market outlook on 23 mar when gold prices was at 1315. Back then the call to overweight on gold was the bearish outlook for the US dollar, the impending recession due to the inverted yield curve and the expectation of the central bankers reverting to another monetary stimulus in the form of modern monetary theory if recession sets in.
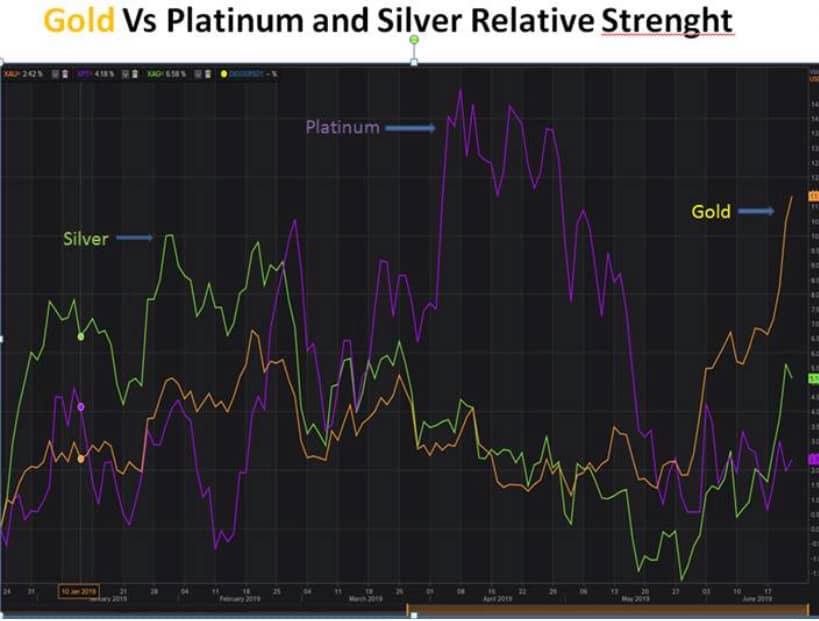
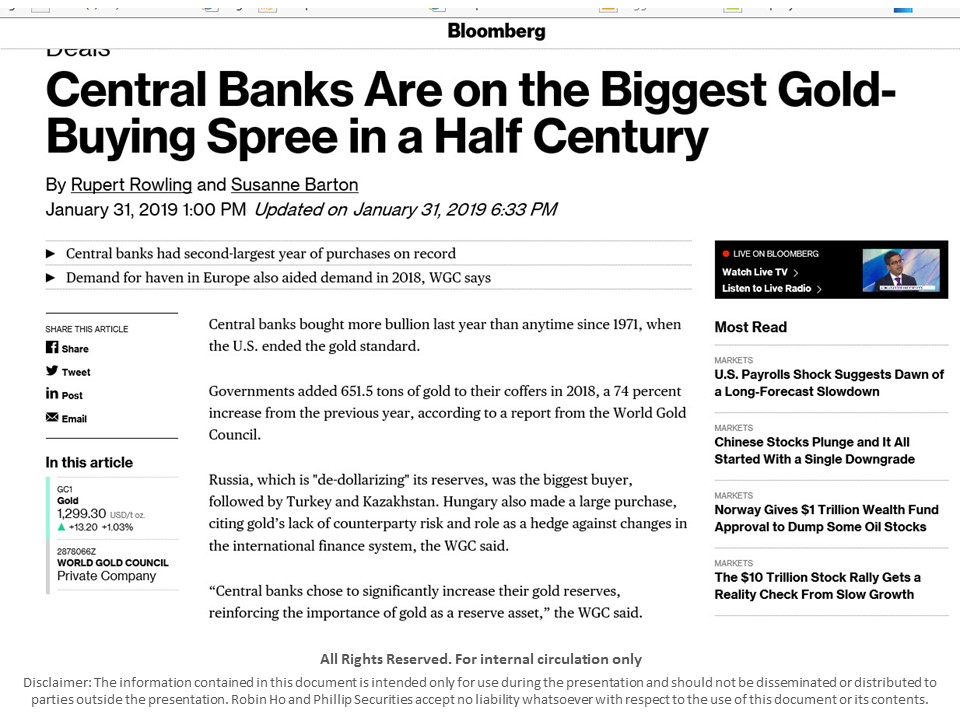
I see 4 signs why the gold bull run is back. First, despite a strong dollar gold was quickly closing in on multi year highs. Second, and perhaps more important, gold mining stocks are outperforming Gold for the first time in many years. This is evident in the Gold ratio index. Because gold stocks provide leverage to the price of gold, they tend to move faster than gold if it is a real bull run. Thirdly Gold is also outperforming the other precious metal like silver and platinum. Fourthly. the world’s biggest central bankers are all preparing to flood the world with “easy money” again and add in the rising Middle East tension and your can expect a explosive move higher.


All posts and charts are for educational and illustration purposes only
Monday, March 25, 2019

Market Outlook March 2019 Highlights

We just wrapped up our market outlook last Saturday, 23 March 2019. More than 300 people gathered to hear Robin share his insights on the market.

The next market outlook has been scheduled on 3 August 2019. Register by Sunday, 31 March 2019 for Super Early Bird pricehttps://bit.ly/2TO076G


Here are the highlights of the seminar.


S&P 500 and US 10 year treasury yield have been diverging

US 10 year and 3 month Yield Curve just inverted, a potential recession indicator


Gold and US dollar are moving in the same direction, a departure from their
usual negative correlation, which casts doubt on the current stock market rally.


All posts and charts are for educational and illustration purposes only
Monday, January 28, 2019

Gold - Holding firm above 200 day moving average

Gold - Holding up firmly above the 200 day moving average. Key resistance at 1305. If it can break an stay above 1305, it will likely head for its next target at 1347 and 1410 respectively.


All posts and charts are for educational and illustration purposes only
Saturday, September 2, 2017

Gold - Bullish Breakout from a 6 months Consolidation Range

Gold - Broke out of a 6 months consolidation zone, reinforce the initial breakout from 1208 to 1294 range to provide an initial breakout target upside to 1350 - 1360. Stay bullish as long as it stays above the 50 Days Moving average

All posts and charts are for educational and illustration purposes only
Monday, June 5, 2017

Gold

On 30 May, when Gold was at 1265 this blog said that Gold was poised to go higher to 1284 based on tradeplan published. Today Gold hit high of 1282. If it can hold above 1284 this blog expect Gold to break its last high at 1295 and head towards its next target at 1315.


All posts and charts are for educational and illustration purposes only
Tuesday, May 30, 2017

Gold Trade Plan

Traders took opportunity to ramp market up when Trump made its first maiden trip overseas as President. With Trump is back to office, the Russia and Comey issues my resurface to haunt the market Gold should benefit. A break above 1284 will signal a new upmove to 1315 and 1340.


All posts and charts are for educational and illustration purposes only
Tuesday, April 11, 2017

Gold

Has been kept down because of expectation of Fed hiking rates and the Trump's reflation story. With Trump's factor taking a back sit and geopolitical tension in Syria and North Korea taking centre stage, its time to look at Gold. Its a matter of time before it will breakout 1621 resistance. It formed a good based at 1200 and has been testing 1261 level many times. This blog believe the 1261 level will eventually be taken out and Gold should head towards 1290 in the short term.


All posts and charts are for educational and illustration purposes only
Wednesday, October 5, 2016

Gold

Fell 2.2 %, breaking  the significant 1300 support but holding above the 200 days MA. The biggest decline since february was triggered by Fed rate hike fear and strong dollar. Currently sitting at its 200 day MA support at 1270. This blog will turn bullish at its next significant support 1220. Gold is expected to stay weak for next  2-3 weeks until we get nearer to the US election in November or when polls shows Trump  to be winning again.
All posts and charts are for educational and illustration purposes only

Gold


All posts and charts are for educational and illustration purposes only
Wednesday, September 21, 2016

Gold

Its about time for the next leg up! After reaching a high of 1375, this blog have a retracement target on the tradeplan of 1310 which was hit today. This blog has been long term bullish on Gold , believe that current correction is only a pullback in a cyclical Bull Trend. Gold could be headed for its first resistance at 1345 and will eventually hit its last high at 1375.

All posts and charts are for educational and illustration purposes only
Friday, September 2, 2016

Gold


All posts and charts are for educational and illustration purposes only
Thursday, July 28, 2016

Gold


All posts and charts are for educational and illustration purposes only
Tuesday, July 5, 2016

Gold


All posts and charts are for educational and illustration purposes only
Thursday, April 7, 2016

Gold


All posts and charts are for educational and illustration purposes only
Friday, February 26, 2016

Gold


All posts and charts are for educational and illustration purposes only