Thursday, May 4, 2017

Advanced Trading Course - The Secret of Short Term Trading with Robin Ho

I will be conducting an advanced trading course to help aspiring traders get started with trading.You may be a new trader, or perhaps you have been trading for many years but there are many doubts which are holding you back, I believe you will benefit from this course! Just like everyone, I have been a new trader before, and hopefully I can shorten your learning curve by sharing from my 30 years of trading experience.

You will learn advanced intraday trading strategies, including:
  • Where and How to Find Stocks to Trade
  • How to Identify High Probability Patterns for Short Term Trading
  • How to Trade Fast Moving Stocks
  • How to Use Market Depth Analysis for Your Trades
  • Proper Trading Psychology, Discipline and Money Management

Course details are as follows:
  • Date: 27 May 17, Saturday
  • Time 900 am - 4 pm
  • Venue: 24 Raffles Place #20-06 Clifford Centre Singapore 048621
  • Lunch will be provided!
To register, click on this link to the course webpage: https://www.champcode.com/sstt/. 

See you there!


Robin Ho

Course Registration

All posts and charts are for educational and illustration purposes only

Alliance Minerals

Resumed trading today after a long suspension. Alliance's strong debut released the much needed liquidity into the speculative stocks market helping to lift the prices penny stocks. Alliance signed an exclusive lithium offtake agreement with a subsidiary of Burwill Holdings but the agreement is still subjected to certain conditions, including a mineral resource estimate of not less than 12000k tonnes with not less than 1.1% Li2O. Traders await for the resource estimate report which this blog believes will be the next catalyst for this stock to move higher. The short term support for this stocks remains at 0.35 and 0.33.


All posts and charts are for educational and illustration purposes only
Friday, April 28, 2017

War Scare On Korean Peninisula

All the talks and tension about possible war breaking out in Korea but the KOSPI continue to break new high breaking out of its 6 years trading range this week above 2,200 level for the first time since 2011. Certainly the price action is Kospi doesn't suggest that war is imminent. Having said that, Trump decision to end "Strategic Patience" with North Korea shows his resolve to seek a decisive resolution to this threat. Gold remains good hedge for investors who are overweight in equities.


All posts and charts are for educational and illustration purposes only
Wednesday, April 26, 2017

Nasdaq (Monthly Chart) - Approaching Multi Year Chart Point at 6150.

Nasdaq could hit a important inflexion point tonight when Trump announce his Reform Tax plan, At this chart point, history suggest the market could correct 20%.


All posts and charts are for educational and illustration purposes only
Tuesday, April 25, 2017

Market Volatility will be Back after Trump's Reform Tax Announcement on Wednesday

Market rally on French Election news and expectation of Trump`s reform tax announcement on Wednesday.  The market  will be strong until Trump`s reform tax announcement which is largely priced in. After Wednesday the market will start to focus on the tension in Korean Penisula and the possibility of US federal government spending shout down if congress don`t pass the spending bill  by 28 April midnight . If Trump insist on building the Mexico Wall , the risk of shut down will heightened. Enjoy the rally until Wednesday , volatility will be back on this weekend.

All posts and charts are for educational and illustration purposes only
Thursday, April 20, 2017

Dow

A month ago this blog has warned that Dow could have peaked at 21150. On 5 Apr, this blog warned that if the crucial support at 20515 is cracked, there is a risk that Dow could fall 400 points to 20100. Yesterday, it tested its 3 months low at 20410. It could stage a minor rebound from here, but as long as it stays below 20515, there is a good chance 20100 will be tested.


All posts and charts are for educational and illustration purposes only
Tuesday, April 18, 2017

STI

The last time it touched the 50 day MA in Dec 16, a huge rally followed. Today it touched the 50 days MA again but this time a correction may be on the cards. The price action is pointing to more weakness ahead. In the short term it could be headed for 3090 and eventually 3030.


All posts and charts are for educational and illustration purposes only
Thursday, April 13, 2017

S&P 500 and the Dow on Wednesday closed below their 50-day moving averages

But both the S&P 500 and the Dow on Wednesday closed below their 50-day moving averages, a technical threshold they last closed under right around Election Day. The S&P fell below its 50-day of 2,351, declining 8 points to 2,344, while the Dow finished Wednesday beneath its 50-day, losing 59 points to 20,591.
The 50-day moving average is just what it sounds like — the average of the last 50 days of closing prices, and technical strategists look at a close below that average as a set up for a potential sell off. Traders will be watching how the stock market moves off of this level Thursday.
All posts and charts are for educational and illustration purposes only
Wednesday, April 12, 2017

Canaccord Colts Initiated Coverage on Tawana and Alliance Mineral

Extracts from Canaccord Colts Research Report


All posts and charts are for educational and illustration purposes only
Tuesday, April 11, 2017

Gold

Has been kept down because of expectation of Fed hiking rates and the Trump's reflation story. With Trump's factor taking a back sit and geopolitical tension in Syria and North Korea taking centre stage, its time to look at Gold. Its a matter of time before it will breakout 1621 resistance. It formed a good based at 1200 and has been testing 1261 level many times. This blog believe the 1261 level will eventually be taken out and Gold should head towards 1290 in the short term.


All posts and charts are for educational and illustration purposes only
Thursday, April 6, 2017

Dow

Made 5 attempts at 20725 last 1 month but failed to hold above. Next minor support is at 20617 but the important support is at 20515. If this level is broken there are only 2 clearly defined support at 20122 and 19955. This 2 supports are very far down from here and it could cause some panic in the market. Fed has turned hawkish, some Fed members even said the US markets are a overvalued in the the minutes of the FOMC. Investor's increased scepticism about Trumps's ability to implement its stimulus policies, including the most important corporate tax cut is causing concern. This poses a risk for the highly valued US market.


All posts and charts are for educational and illustration purposes only

Market Depth Trading Strategies at SGX!

Last night's topic was unusual. It attracted many seasoned traders. It was maximum capacity crowd at the SGX auditorium with many people left without seats. I shared about how to identify fake and real buy/sell queue, how to identify stocks that are controlled by program trading, how to integrate market depth with volume distribution and price action on the charts. I gave real case studies of stocks traded over the last days to show how market depth could be use to pin point price target. For those who cannot get a ticket to come tonight . SGX is considering a rerun due to the overwhelming response tonight. Stay tune to SGX academy website https://www.sgxacademy.com/ for the next seminar!


All posts and charts are for educational and illustration purposes only
Tuesday, April 4, 2017

Free Preview Seminar for MTM Course June 2017

*Update: the preview session on 10 April has been changed to 18 April 2017.

I will be conducting a series of preview seminars for my upcoming Master the Markets advanced trading course in June. The first one will be held on:

  • 10 April 2017, Monday 18 Apr 2017, Tuesday
    7 pm - 9 pm
    17 Phillip Street
    #08-00 Grand Building
    Singapore 048695

If you are interested or have any enquiries about the course, you can contact our course manager:

  • Andy Tan
    6505 0192
    andytanst@cyberquote.com.sg 

Register for the free preview seminar here! See you there!

  • https://cyberquote.wishpond.com/landing-page-robinho/


All posts and charts are for educational and illustration purposes only
Monday, April 3, 2017

Alliance Minerals

Amazing recovery inspite of being designated as a restricted share by major broking houses. Last Friday i shared on the chat group that 0.285 was a strong support on my tradeplan and that happened to be the low for friday. This blog believe that today's price action is very bullish for 3 reasons:
1. weak holders were flushed out on friday
2. since many houses need cash up front to purchase this stock, more strong players are in this trade.
3. inspite of limited credit in the market, this stock still attract strong order flow. Could be a sign of good news in the offing.


All posts and charts are for educational and illustration purposes only

Tawana (Alliance Mineral's 50% JV partner in Ball Hill Park Lithium Project)

Its share prices were taking new high recently while Alliance share price was hammered last week when broking houses restricted buy limit on this stock. This blog continued to stay bullish on Alliance for all the good progress on the project and imminent report of 'Mass Production Viability' and results of Advance talks with off-takers.


Below extracts from Tawana recent project presentation:


All posts and charts are for educational and illustration purposes only
Wednesday, March 29, 2017

Alliance Minerals

Market keenly awaits news of deals with the Off-Takers which the company is in advance stage of negotiation. Technically it broke above all resistance levels except the last one at 0.435 which is also its all time high. The stock will go into uncharted territory if it breaks above this level. At today's close of 0.395, its market cap is 180m.


All posts and charts are for educational and illustration purposes only
Monday, March 27, 2017

Alliance Minerals

On 21 Mar when Alliance was 0.26 this blog said that Alliance could hit 0.36 on more positive news. Today it reached 0.36 which its this year's high on a blow out volume. This blog believe it's time for Alliance to take a short break and could correct to 0.30.


All posts and charts are for educational and illustration purposes only
Friday, March 24, 2017

Why Is Trump In a Rush To Push Through The Reformed Healthcare Bill?

Trump failed to close the deal within his party on time for the planned Thursday healthcare vote inspite of much wheeling and dealing with  Republican lawmakers . The vote has been seen by financial markets as a crucial test of Trump's ability to work with Congress to deliver on his other priorities, such as tax cuts and infrastructure spending.

Even if their replacement plan does eventually get approval from the House, the legislation faces a potentially tough fight in the Republican-controlled Senate.

The House and Senate had hoped to deliver a new healthcare bill to Trump by April 10, when Congress is scheduled to begin a two-week spring break. The deal needs to be approved before Congress go for their  long break. Trump appears to understand this which is why he conducted closed-door meeting with

House of Representatives Republicans on Tuesday and Wednesay  to lobby support  for the Healthcare reform bill in order to avoid a significant delay in implementing tax reform.

For the the short term, the markets is concerned whether the Trump administration’s tax cutting plans get delayed . If the Healthcare reform bill is delayed beyond 10 April, the market could sell down  in view of the delay in tax reform.
All posts and charts are for educational and illustration purposes only
Thursday, March 23, 2017

STI

Showing signs of breaking down. Any break below 3115 could take the index down to 3050.


All posts and charts are for educational and illustration purposes only
Wednesday, March 22, 2017

Dow

On 28 Feb this blog said that Dow could be close to its peak and on 2 Mar Dow had in fact hit its highest point at 21180. Dow fell 237 pts to 20668 on Tuesday,  its biggest decline since Trump election. Going forward Dow will continue to trend downwards with supports at  20275, 20090, 19900, 19723 and 19170. Traders are beginning to doubt Trump's ability to fulfill his election promises and they will be watching Trump's attempt at congress to repeal Obamacare. Any mishaps in Obamacare repeal effort will cause more selling in the days ahead. Traders also know that the  introduction of Border Tax and Infrastructure stimulus will have to wait for the outcome  of Obamacare repeal. Traders will likely run out of patience and it could trigger more selling.


All posts and charts are for educational and illustration purposes only
Tuesday, March 21, 2017

Alliance Minerals

Heading skyward on lithium play. Company last reported promising presence of high grade lithium deposit drove the price from 0.2 to 0.245. Today the price broke the last high of 0.245. The next catalyst for this stock will be news of off take deals size. A sizeable off take deal will give analyst some tangible revenue base to value this stock and kick off the lithium product process. A big pre order off take contract can drive the price to 0.36.


All posts and charts are for educational and illustration purposes only
Monday, March 20, 2017

US Dollar Index

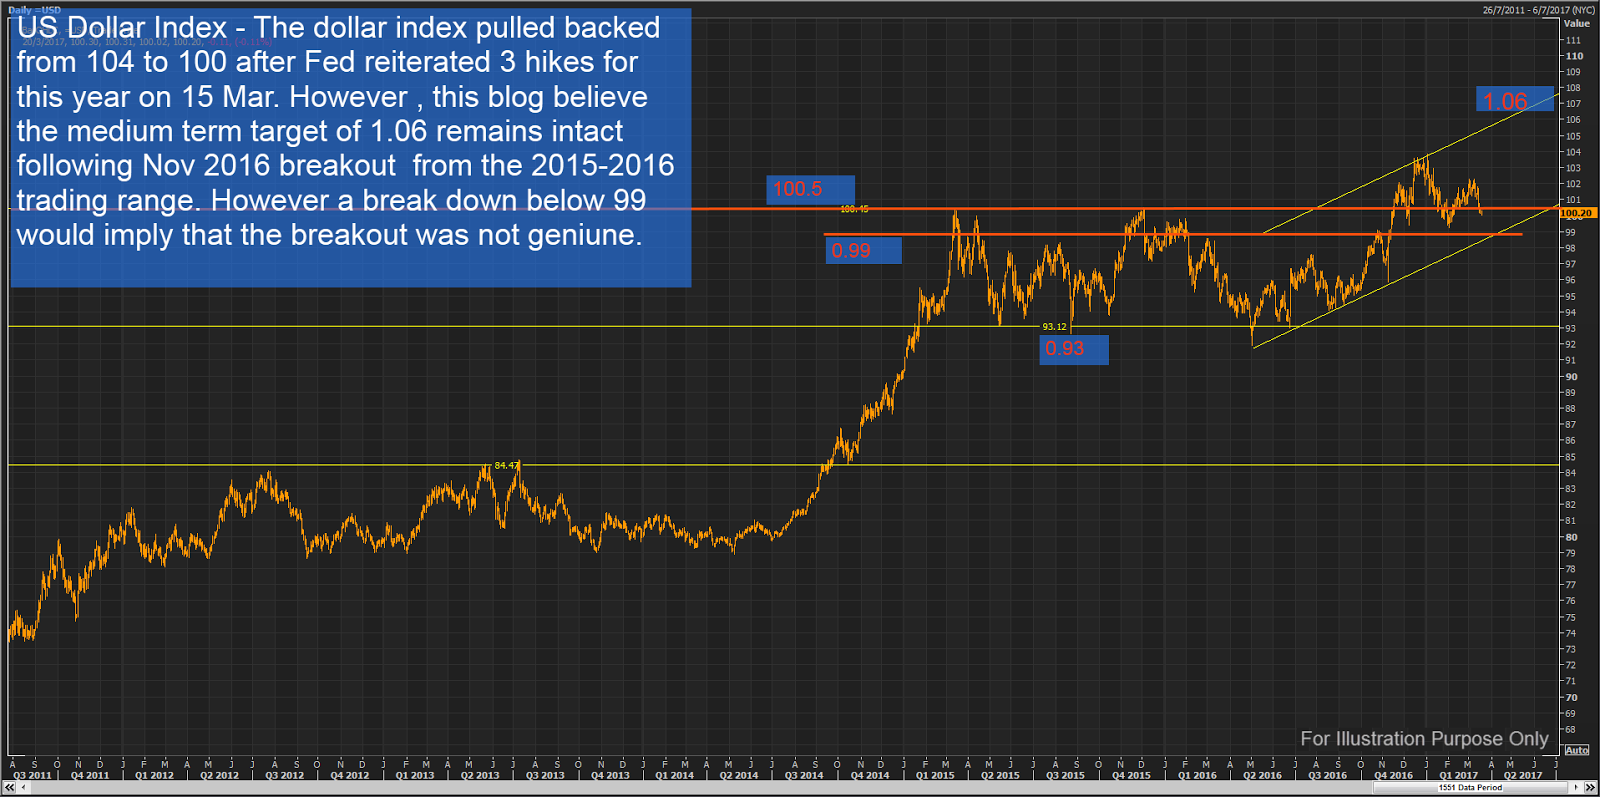
The Dollar Index pulled back from 104 to 100 after Fed reiterated 3 hikes for this year on 15 Mar. However, this blog believe the medium term target of 106 remains intact following Nov 2016 breakout from 2015-2016 trading range. However a break down below 99 would imply that the breakout was not genuine.


All posts and charts are for educational and illustration purposes only
Friday, March 17, 2017

Russell and S&P - Signs of impending US Market Correction

On 28 Feb, this blog warned of Dow peaking from analysis of Dow's trend cycle. Perhaps another sign of impending correction is seen on performance the Russell 2000 index of small cap stocks. They have stopped outperforming the S&P, the Russell index has risen 1.9% so far in 2017 compared to 6.5% gain in S&P.


All posts and charts are for educational and illustration purposes only
Thursday, March 16, 2017

Noble

Company announced 10 to 1 share consolidation frightened traders into a knee jerk sellout! At the end of the day, it looks like traders got tricked, the BB scooped up the share on weakness and closed it at today high. The short term Price Action is pointing to more upside in the short term. It will be met with resistance from 0.22 to 0.225. A convincing break above 0.225 will signal strong underlying strength and upside to 0.255.


All posts and charts are for educational and illustration purposes only
Tuesday, March 14, 2017

Robin's Master the Market Course - Last Call!


Robin's Master the Market course will be commencing this Friday! Contact Andy Tan from Cyberquote at 65050192, or email andytanst@cyberquote.com.sg to sign up!


All posts and charts are for educational and illustration purposes only
Monday, March 13, 2017

Robin Won 5 Awards at Phillip Securities Awards Night 2017!


All posts and charts are for educational and illustration purposes only

Market Moving Event this Week


·         The BOJ is set to keep its rates and yield-curve policy unchanged in its policy decision on Thursday

·         The Netherlands’ election takes place March 15 amid a growing diplomatic spat with Turkey.

·         FOMC Meets  from 14 to 15 Mar

The commentary of the dot plot could drive a short-term movement in the market, the odds could  favor more dots, favoring more rate hikes, the dollar could weaken early in the week due to technical selling, but if it turns out to be a more  hawkish hike and I think the market is underestimating the hawkishness . It could trigger a market correction.

US debt ceiling expires on 15 Mar

All posts and charts are for educational and illustration purposes only
Wednesday, March 8, 2017

SGX Live Trading Monday with Robin Ho - 6 March 17

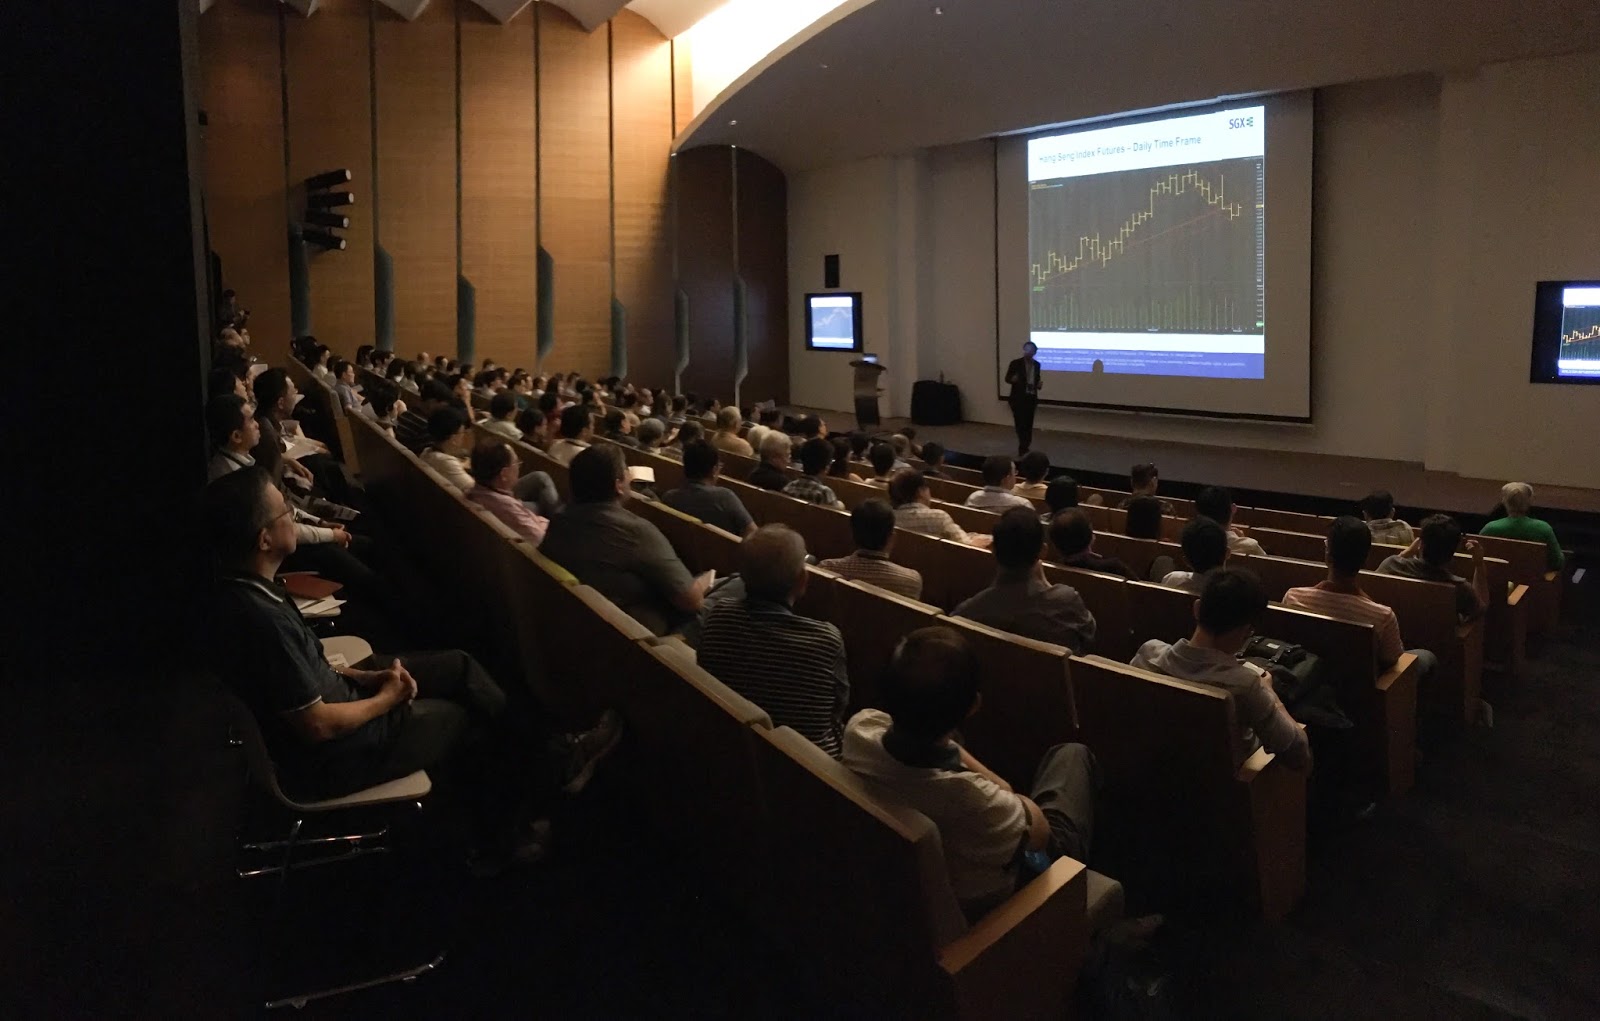
Every 3 months I receive invitation from SGX to conduct a live trading session where I would trade with my own money in front of about 200 people. The best outcome would be a profitable intra day trade i.e. 0900 to 1130 which is the duration of the seminar. I would typically trade Hang Seng future because of its volatility. This is probably the 15th time I have traded live in SGX and I have only lost on one occasion. Yesterday I made money again but that's not the important, because the objective is to drive home the point that trading is not a gamble. It is about having a well prepared trade plan and trading the plan. I showed the crowd how I use my proprietary Price action strategy which uses only Price , Volume and psychology of trading to profit from the market in a very short time frame. It was an eye opener for many who witnessed how live prices moved precisely as predicted. My special appreciation to the organizer SGX and those who took special leave to attend the session.


All posts and charts are for educational and illustration purposes only
Tuesday, March 7, 2017
Monday, March 6, 2017

STI

Sign of deteriorating breadth and momentum but index is hanging inside the uptrend channel. Watch the key support at 3100. A break below this level may trigger a major correction bringing the index down to 3030. If index can hold above 3100 the STI uptrend will continue with the next target at 3170.


All posts and charts are for educational and illustration purposes only
Tuesday, February 28, 2017

Keppel Corp

Completed Trend Cycle and achieved Price Target at $7. Could correct to 6.40 in the near term.

All posts and charts are for educational and illustration purposes only

Dow Jones - Very close to completing its trend cycle.


The market continues to break new high with Trump's promise of tax reform and fiscal stimulus. Trump is addressing congress tomorrow at 10am Singapore time. Traders will be looking for details of his promises. If he disappoints it could trigger a much awaited correction. 


All posts and charts are for educational and illustration purposes only
Thursday, February 23, 2017

Golden Energy

A coal play like Geo Energy. After a 1 month consolidation between 0.52-0.55. This stock broke out on the very high volume, a pull back to 0.565 will present a good opportunity to get into this stock. It should be heading for 0.65 in the medium term.

All posts and charts are for educational and illustration purposes only

UPP

Correction should be over soon. Today it sits on its long term support at 0.275. If it holds above 0.275 for the next couple of days, we could see a rebound to 0.34.


All posts and charts are for educational and illustration purposes only
Monday, February 20, 2017

Market Outlook 18 Feb 2017


Awesone ! More than 400 people came for this market outlook event last Saturday held at Nexus Auditorium . This quarterly event has been gaining traction amongst retail investors and its turning out to be one of the biggest market outlook seminar in Singapore !
Investors gain Insights into macro trend on a global perspective and how this trends could be transform into actionable and profitable trading/investments ideas . Retail Investors gain rare insight into professional proprietary trading and investment strategies and into topics, such as equities, commodity , money markets and commodities markets . My deep appreciation to all who supported in this event and hope to see you at the next Market Outlook event scheduled on  8 July. Stay Informed and Be Ahead!

Thanks also to Cyberquote for organizing the event.


All posts and charts are for educational and illustration purposes only
Thursday, February 9, 2017

Noble

A significant day in Price Action with the largest volume recorded in the last 2 months. Some resistance at 0.185 but this blog believe it could break above the resistance and reach for 0.205.


All posts and charts are for educational and illustration purposes only
Wednesday, February 8, 2017

Artivision

Moving up as predicted. On 2 Feb when Artivision broke above strong resistance at 0.021, this blog said it would be heading for the 0.026 and 0.03 price level. Today it hit a high of 0.032 before settling at 0.031 on a massive volume. Before the stock can race to its next target at 0.04, it could take a little rest here. Any pullback to the 0.026 level will be a good time to accumulate for the next push.


All posts and charts are for educational and illustration purposes only
Monday, February 6, 2017

Fu Yu

A breakout above 0.205 is imminent! Tested 0.205 for the 7th time today in the last 10 months. The price action is indicating that buyers are trying to exhaust the huge supply at 0.205. It's a matter of time before the selling is exhausted and the buyer take control. A break above 0.205 will catapult the stock towards 0.23. Above 0.23 will be a zone of no resistance and the sky is the limit.


All posts and charts are for educational and illustration purposes only
Thursday, February 2, 2017

Artivision

Evidence shows it could have bottomed and the beginning of an uptrend have started. Breaking above crucial resistance of 0.021, Oxley boss Ching Kiat Kwong took a controlling stake of 24.5% after a 246 new share placement. hiving off their core business Artmedia for $50m are signs of a New Dawn for the company. Near term resistance at 0.026, 0.03, 0.04 with 0.07 as the eventual medium term target.


All posts and charts are for educational and illustration purposes only
Tuesday, January 31, 2017

Dow - Fake Breakout?

If Dow is unable to stay above 19975 tonight, traders who bet the next bull leg above 20,000 will unwind long trade and that could take the market to 19742 and 19236. For this week it is unlikely that Trump will roll out more major policies as he is busy with the fallout from his immigration policies. This blog still believe that Dow has one more melt up when Trump slashed the corporate tax from the current 36% to 15%.


All posts and charts are for educational and illustration purposes only

Trump's Rally and Inflection Points

Trump has surprised many by fulfilling his campaign promises! These has kept the US market rally going and breaking new high .

When will this rally end? This blog believes that the market is awaiting the announcement of most interesting and potent policies that could give the US market the last 'melt up' . It's Trump's promised to slash the top corporate tax rate to 15% from the current 36%.

Trump’s plan to slash the top rate in half is unprecedented, the reason why any significant slash could be a boon for stocks is straightforward: It quickly could boost per-share earnings of profitable companies. That would make U.S. stocks look more attractive versus bonds and other global investments. The lower taxes leave more retained earnings available to companies that want to use it for investments or share buybacks, that’s also a boon for stocks. He has also promised to ease strictures on oil, gas and coal energy companies. Trump's policies promotes economic growth. The stock  market are already shifting away from consumer staples, utilities and REITs to financial services, manufacturing and energy.

Trump's ultra pro growth policies will continue to be a boost to the U.S dollar. Trump calls China a “currency manipulator” and threatens to impose tariffs up to 45% on imports from China. it sounds like he’d like the dollar to weaken versus the Yuan. But actually, most of his plans are likely to lift the dollar . It seems inevitable if the U.S. economby booms the dollar bull will continue.

Fed seemed to acknowledge finally that America has almost reached full employment. This suggests that there should be a bias towards tightening, and therefore “normalisation” of monetary policy, so long as wage pressures continues to rise. This raises the potential for a monetary tightening scare if wage pressures continue to rise in America and The Donald seeks to implement aggressive fiscal easing.

This blog expect a round of “quantitative tightening” by central banks in the 2nd quarter in the year to prove “risk-negative” for markets.

The bottom line is 2017 carries the potential for rising rates and falling earnings, a “complete reversal” of the falling rates and rising earnings that contributed to big gains for stocks. It's going to be tough for trump to hold up the  “second greatest bull market,” in US history.

In a Greek myth , Icarus ignored his father’s warnings and flew too close to the sun, melting the wax on his homemade wings and plunging back to earth.

Beware of 'Icarus Trade' , we are getting closer!

Have a blessed Lunar New Year . 'Gong xi Fatt chai '
All posts and charts are for educational and illustration purposes only
Tuesday, January 24, 2017

British Pound

Could have bottomed! Trump meets Theresa May this Friday and bilateral trade arrangements is set to be on the agenda. With US formally withdrawn from TPP today and Theresa may setting out the details of a clean BREXIT, this blog expect one 'Game Changer' trade arrangements. The biggest beneficiary could be the Pound. Technically it looks to have bottomed out after a prolonged collapse on BREXIT worries. Currently trading at 1.252 to USD, the next resistance is at 1.29, 1.33 and eventually 1.40 according to this tradeplan.


All posts and charts are for educational and illustration purposes only
Friday, January 20, 2017

US 10-Yr Treasury Yield

Bouncing of the 50 days moving average. The world awaits Trump's inaugural speech tonight. Announcement of aggressive tax reform fiscal stimulus and protectionist policies will cause yield to test the last high again and the dollar index will spike. This blog believe Trump's policies will ultimately push the yield to 3 % which is where stock and bonds will collapse in unison.


All posts and charts are for educational and illustration purposes only
Wednesday, January 18, 2017

Yoma

Ripe for the next run up. Consolidated on a narrow downtrend since Aug last year. Could break out soon, watch for it.


All posts and charts are for educational and illustration purposes only