One Good Trend, One Good Bar, One Good Volume - The Secret to Trading Successfully!
Phillip Capital's Top Tier Trader and Remisier.
Robin Ho is also a certified SGX Academy Professional Trainer.
Hang Seng Index - Too Crowded at the top! Something must give way! A correction is on the cards.
Could have seen its peak for the medium term after hitting a high of 33484. Could be heading to its immediate support at 31950 and 31550. A break below 31550 could see prices skidding towards 29250
All posts and charts are for educational and illustration purposes only
Last week, we celebrated the first batch of graduates for my Master the Markets (MTM) Professionl Trading Course. This round, we focused more on hands-on exercises with the Metastock Xenith Charting Platform. Over the two week period of the course, the class and I tracked a portfolio together, and experienced first hand how the prices moved according to the trade plans they created. Our next intake will be in April, see you there!
Graduates of MTM Course 2018 Batch 1
Testimonial by James:
"This is the second stock trading course that I have attended. I find it very useful. For the first time, I learned how to draw trend lines, and the course has helped me understand when to buy, and more importantly, when to sell. Now I can be my own analyst, and rely less on guessing. We could follow Robin's trades during the course, and he also does regular live trading, which gives us great confidence to emulate him in his trades."
Testimonial by Dewi:
"I have been trading Forex for quite some time, but I have always relied on my gut feelings. Robin showed us how to analyse the charts and create a trade plan.I hope after the course my life will be changed and I can make a lot of money from trading."
All posts and charts are for educational and illustration purposes only
One of my strategy for straddle trading and spotting 'alphas' among winners (the front runners ) is through the Rebasing Chart available in Metastock Xenith. To find out more watch this video: https://www.tradingkungfu.com/v/mtm-rebasingchart/
All posts and charts are for educational and illustration purposes only
Ying Li - After a relentless downtrend from 2013 to 2015 followed by a rangebound trading between 0,13 and 0.20 from 2015 to date, is the stock finally turning up? The share price jumped 15% or 0.024 to close at 0.178 following news of its proposed divestment of Ying Li International Commercial Centre to China Evergrande for Rmb3.29b. The company is expected to realise a disposal gain of Rmb 343m. Today the stock spiked up after a off market married deal of 153.4m shares changed hand at 0.135. Who took the block of shares? This suspense is adding to the bullish sentiment today , on the chart it looks like this stock is poised to test its next resistance at 0.194 followed by 0.21. A break above 0.21 should herald a start of a new uptrend for this stock with targets of 0.24 and 0.28. An estimated NTA at 0.40 also imply it is attractive at current price.
All posts and charts are for educational and illustration purposes only
Friday, January 19, 2018
Semcorp Marine - Old rumour of Sembawang Marine potential privitisation or divestment of Sembmarine by the Sembcorp Industry and Nomura upgrade to target 2.70 cause the share to race to 2.30 from 2.10. Like they say there is `No Fire Without Smoke", it could go further up to 2.38 and retrace to 2.23 , this will be a good level for an entry to ride this trend. This blog maintain a price target of 2.56 in the medium term.
All posts and charts are for educational and illustration purposes only
We are into the third day of Robin's Master the Markets (MTM) course. Glad that the students are enjoying the course and have benefited from. Check out the testimonials by Zavier and Daniel!
"This is only the second day of the course, and I have already learned many strategies which are applicable to the market. I plan to start trading after the course and I am confident I am going to make money this time!"
"This is the third day of the course about price action. In the course, I learned about the concept of price and the concept of volume. With these, i can put together a trade plan, which I can use to determine the entry point and exit point. It is really a life skill learned. I am looking forward to the rest of the course!"
All posts and charts are for educational and illustration purposes only
In this current super bullish environment where the bulls runs rampant and bears of any kind nearly wiped out, it's takes a brave bear to say the market is due for a correction. Looking at this tradeplan which has served this blog for the last 6 months with distinction. This blog can't help but say that STI is due for a correction in the near term. STI nearest support is at 3490, a break below this level will bring the index to 3465 ,3425 and 3395. The current bull market is undermined by the successful passage of the US reformed tax, synchronized global GDP growth, low inflation and a depressed USD. This week investor need to watch the PPI and CPI figures coming out of US on Thursday and Friday. Analyst is not expecting any increase in the figures but this blog believes that with the tight job market and the rally in commodity prices, it is only a matter of time inflation will surface to jolt the bull.
All posts and charts are for educational and illustration purposes only
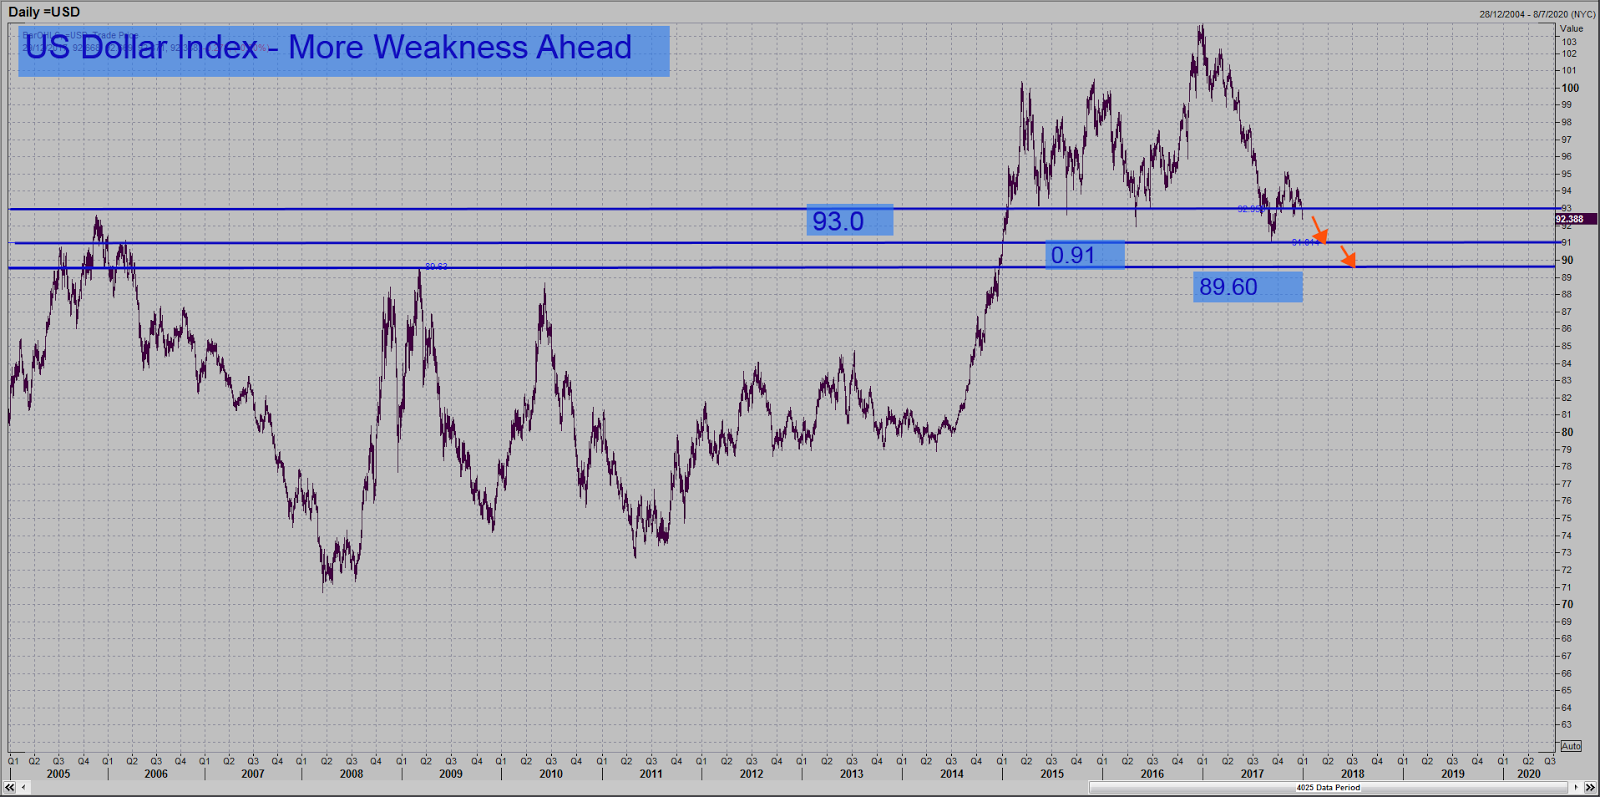
The market had expected that passing of the Trump's US Reform Tax will mean the USD will rally more and the US yield curve will steepen further, instead we are seeing a creepy USD weakness and the US yield curve flattening with the US 10 Year treasury yield coming down. The markets are clearly showing scepticism about the long term stimulative effects of Trumponomics trade. This blog base case on the dollar index is that sooner rather than later to test will test its 3 year low at 91.0, This will trigger more fund flow to Asia and the emerging markets. This blog remain a bearish on the dollar maintaining a sell into strength until the Dollar Index hit 0.91.
All posts and charts are for educational and illustration purposes only
US 10 Years hits 9 months high and the chart looks like climbing higher staying firmly above the 100 days MA. The yield is at 2.49% , if it hits the year high at 2.62, the Reits, Telcos and yield stocks will start to hurt , rising rates while boosting the banks will cause Technology shares to come under profit taking. The rise in yield is caused by the passage of the US reform tax bill in anticipation for faster economic growth and added supply of bonds to finance the impending budget deficit. If energy prices which is inflationary continues to rise bond yields will continue to accelerate upwards.
All posts and charts are for educational and illustration purposes only
China could face a short term sell off caused by China’s deleveraging campaign with
the renewed squeeze of the shadow banking sector implemented following the Party Congress in October. It
has caused the 10-year renminbi
government bond yield rising to 3.93% on
Wednesday. The aim is to squeeze out shadowy loans and encourage more loan growth
to the real economy. China Securities Regulatory Commission (CSRC) recently
suspended approval of new mutual funds that plan to allocate more than 80% of
their portfolio to Hong Kong-listed equities. It could result in a short term cooling of South Bound fund inflows, further
aggravating by the normal seasonal decline in A share trading volume in the run
up to Chinese New Year in 16 February.
Indeed that growth scare has already begun, The Caixin/Markit
manufacturing Purchasing Managers' Index came in at 50.8 for last month — the
lowest level in five months Economists in a Reuters poll had expected the index
to read 50.9 for November, lower than 51.0 the previous month.
On 27 Nov, this blog predicted that the Shanghai A Index
has peaked and is due for a sharp correction just from a technical perspective
. Indeed the Shanghai Stock Exchange A Index (SSE A) underperforming the MSCI
Asia Index and trading at a 5 month low. The SSE A index has broke its uptrend
channel line, with immediate support at 3445 , its is likely to trend lower in
the near term towards 3355 and it will drag the Hang Seng lower.
All posts and charts are for educational and illustration purposes only
Hi there! I will be organising a MetaStock XENITH Platform Training session on 9 December 2017. Details of the session below:
Date: 9 December 2017 (Saturday)
Time: 9am - 12pm
Venue: International Plaza #36-05A
In this session, Kian Ann will cover more in-depth on how to use the different applications within MetaStock XENITH, including:
Monitor
Charts
News
Time and Sales
Company Overview
Economic Monitor
Rebasing Chart... and more
The session is free, so do come on down to learn more about the power of MetaStock XENITH. If you have attended this training before, you can re-attend as a refresher. You can register for the session here: https://www.tradingkungfu.com/xpt
All posts and charts are for educational and illustration purposes only
The traditional year end buying could mean that the "Santa Claus Rally" is still on the cards.
However, the selling pressure of late for technology stocks may continue, as after taking a closer look at the Republican tax bill, tech companies could be hit harder by the corporate Alternate Minimum Tax (AMT). This measure was removed from the House tax rule, but included in the Senate bill, and it must be resolved before the overall plan is passed.
A lot of stocks could be dumped in late December in order to be taxed under the old rules if the House bill keeps these penalties in place.
All posts and charts are for educational and illustration purposes only
Hi there! I will be organising a MetaStock XENITH Platform Training session on 9 December 2017. Details of the session below:
Date: 9 December 2017 (Saturday)
Time: 9am - 12pm
Venue: International Plaza #36-05A
In this session, Kian Ann will cover more in-depth on how to use the different applications within MetaStock XENITH, including:
Monitor
Charts
News
Time and Sales
Company Overview
Economic Monitor
Rebasing Chart... and more
The session is free, so do come on down to learn more about the power of MetaStock XENITH. If you have attended this training before, you can re-attend as a refresher. You can register for the session here: https://www.tradingkungfu.com/xpt
All posts and charts are for educational and illustration purposes only
Tuan Sing - UOB Kay Hian initiated a "Buy" recommendation yesterday with a target price of 0.71 representing a upside target of more tan 70%. The report cited the potential of its huge $2.3 billion property portfolio in Spore and Australia bought a fire sales price and it is trading at 61.2%discount to RNAV and 52% of its book value. The fundamental reasons to buy this stock looks compelling and many investors jumped in to buy in the last 2 days as evident in the massive volume traded which was the highest 2 days volume in the last 3 years.
The Price Action, however suggest that this stock could have peaked in the short term and is likely to correct to 0.43 before it could attempt higher prices.
If the 0.43 level is breached the stock could head south towards 0.36 which will present and excellent opportunity for traders to buy for a good rebound.
All posts and charts are for educational and illustration purposes only
Yangzijiang - Testing the 50 Days Moving Average Again! Since beginning of the year been the 50 days MA has proven to be a reliable support. This time round Price Action is suggesting that it could be breached. The next crucial support is 1.48 and 1.40 respectively.
All posts and charts are for educational and illustration purposes only