

I predicted BTC crash three days before it happened, based on this chart pattern.
S&P chart pattern looks similar “Three Peaks and A Rebound”
Could it happen again?
All posts and charts are for educational and illustration purposes only

I predicted BTC crash three days before it happened, based on this chart pattern.
 |
| Bloomberg Commodity Index |


Ethereum - The correction have Begun ! After a stellar 2 months breathtaking run , it’s taking a rest . First target for the short term is 3382 .

Bitcoin - The Price Action is setting it up for a steep fall . Having consolidated between 4500 to 60,000 since feb 2021 , the price action is suggesting we are in a distribution phase where the big boys could have or are on the process of exiting . The 47224 level is a crucial one , if it breaks we could see prices heading for 39115 which coincides with the 200 days MA.
US 10 year treasury breaking out after a 1 month consolidation. Stock market could correct if it challenges the last high at 1.71.

Bitcoin broke its 4 months uptrend channel and is threatening to break below the Ichimoku Cloud. It could be heading for the next targets 44700 and 39115. 57000 is a key level. In the short term, do not turn bullish unless price breaks above 57000.


JD.com is exhibiting a short-term bearish price action and
is trading below its 100-MA (347) today.
Its current support is at 323, could correct to support
levels of 300 and 281 in the short term from its current price of 323.
Stop loss at 358.

After a week of bullish uptrend, the stock is exhibiting a short-term bearish price action today.
Resistance is capped at 28.60, could correct to support
levels of 27.33 and 26.49 in the short term from its current price of 27.85.

UST10 Year Treasury – The chart is pointing to a target of
2.5% and the uptrend has started and it is resisted currently at 1.6%, it
should break above the 1.6% mark to ahead for the 2.00% level.
The key resistance remains at 2.50% and I expect the Fed
will not tolerate rates above 2.5%. This could be the level the Fed will act to
bring the long term yield down. The impending yield increase will inevitably
result in valuation reset in equities especially the Tech stocks.
The IIF recently released its Global Debt
Monitor which reported that total global debt had reached US$280 trillion and
the worldwide debt-to-GDP ratio is now at 355%. How this will ever be repaid I
have no idea. How this will be serviced if interest rates were to rise is
another matter to ponder. debt servicing costs would increase by several
trillion dollars should average interest rates simply rise to pre-GFC levels
…..more money printing to get out of the debt hole? US personal savings
rate has now risen to 20.5% from 13% with the potential to rise even more if
biden 1.9 trillion stimulus reaches the US household. The stage will be set for
a consumer spending boom , all these are pointing to higher rates and
inflation.

China Construction Bank (0939.HK) broke out from its recent year high of 6.55 trading at a high of 6.65 today (08 March 2021) before retracing to 6.59.
It is heading towards testing my first target at 6.66 and
if it breaks out further it could be heading towards my second target at 6.84.
If prices break below 6.30, the trade plan is not valid
anymore.
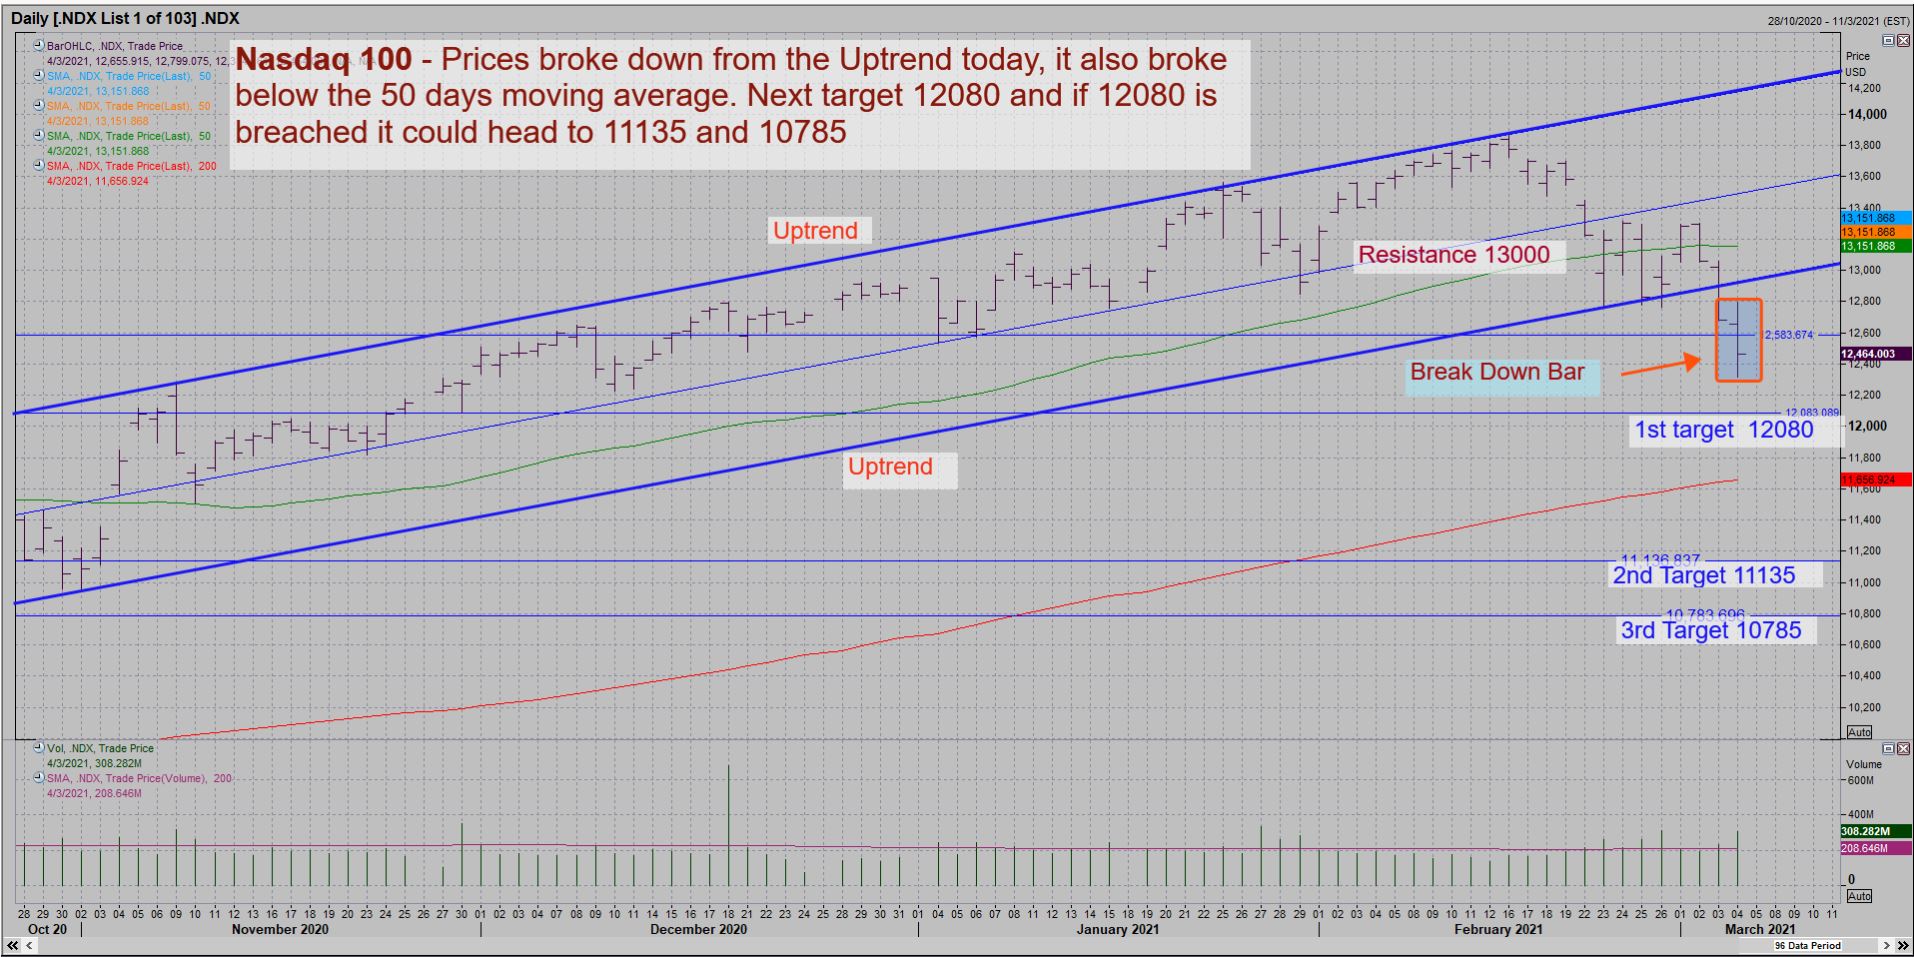
Nasdaq-100 broke down from its upper trend channel

The fundamentals of China BlueChem (3983.HK) looks promising with Crop price at 7-year high, driving fertilizer demand and global tight supply of urea. Domestic urea price rose Renminbi 200/ton MoM to Renminbi 2,100/ton in early-Feb, due to spike in global pricing (up more than 30% since end of 2020).
The stock is poised to benefit from the year on year jump in
urea given its relatively stable natural gas cost under long-term contracts.
Looking at the technicals, the stock has broken
out from its long-term downtrend, trading at a day-high of 2.12 (at the point
of this write up) today and its bullish chart pattern showing further potential
upside.
First Target – 2.30
Second Target – 2.48
Third Target – 2.95
Stop Loss – 1.75


Inflation is on the rise , question is, does the market really care. Obviously, it hasn’t cared yet. I think it’s the biggest risk. Nobody is really bother because of the belief there will be fiscal stimulus and that it’s going to be highly supportive of economic growth and the stock market.
 |
| CEIC Data, Eurostat |
 |
| ISM, CEIC Data |
Central banker indiscriminate easy money policies has flooded the world with fiat money with Federal debts held by pubic equivalent to world war 2 levels . We are in the midst of the largest monetary experiment in human history, with no foreseeable end. Governments worldwide are adopting quantitative easing policies while simultaneously running progressively larger deficits on top of increasingly untenable debt levels. Considering that 25% of all US dollars ever created were made in 2020, bitcoin could also act as an insurance policy against monetary and fiscal irresponsibility from central banks.
 |
 |
| Ethereum |
 |
| Bitcoin |
The charts of US Major Indices are showing the narrative that their respective Price Action Trend Cycle are maturing at the same time.
Both the S&P 500 & Nasdaq-100 are currently trading at the upper band of the Bollinger with the S&P 500 trading at 15% premium to its 200-MA while Nasdaq-100 is trading at 20% premium to its 200-MA.
Since 1997, the S&P500 has traded at a 15% premium to its 200-day MA on 14 occasions with a subsequent average drawback of -0.9% from these levels.
As for Nasdaq-100, it currently trades at the upper band of the Bollinger and 20% premium to its 200-day MA. This is the 18th time the Nasdaq 100 has traded under these conditions with subsequent average pull-back of -0.95% after reaching these levels.
We at the stage of the financial market where the market’s most aggressive energy has gone racing toward “pre-profit” growth companies, long-shot emerging growth and massive SPACs listing and acquisition spree.
Stock like Gamestop or a Plug has been dramatically surging within a one-month period with momentum investors chasing on them.
Such a euphoria bears a resemblance to that of the 90’s dotcom bubble where this sort of thing kept rolling until the Nasdaq doubled in less than a year and a few-hundred IPOs hit the market before an inevitable correction.
Nobody knows when the market is going into a meltdown. However, the ingredients of a significant correction are in place.
The charting model used has been spot on many occasions and there is reason to believe that a correction is impending.
 |
| Figure 1: S&P 500 Valuation |
 |
| Figure 2: What type of bubble are we in |
 |
Figure 3: Dow Jones’s Price Action Trend Cycle Is Maturing |
 |
Figure 4: S&P 500 ‘s Price Action Trend Cycle is Maturing  Figure 5: Nasdaq-100 ‘s Price Action Trend Cycle is Maturing |

Like China Mobile, CRCC (1186.HK) finds itself being in the crosshair of the US government.
US funds are barred from investing in CRCC as the company
is controlled by the Chinese government.
The stock showed potential signs of bottoming from market
capitulation (5 January 2021) trading at low of 4.10 after the stock was being
removed from the major index providers such as the S&P, Dow Jones, MSCI and
FTSE.
The stock has since rebounded by more than 20% after China enacted
new countermeasure rules to shield its companies from “unjustified sanction”.
The stock currently trades at 5.03 (at the point of this write
up), the immediate target level could be 5.51. If the stock does breaks 5.51, it
could reach target of 5.70 and 6.00 with a long-term target of 6.55.
