Tuesday, May 30, 2017

"The Secret of Short Term Trading" Course for Advanced Traders

Last Saturday, I spent a fruitful day with a bunch of passionate traders at my inaugural advanced short term trading course. This is a very unique course in which I delved directly into the nitty-gritty of trading, from mining for stocks to using advanced tools such as tick charts, price-volume profiles, and market depth and bringing them together in my proprietary trading strategies. I shared extensively from my 30 years of trading in the stock market, and I am glad the class was well received!

Here are some of the topics which I covered during the course:
  • How professional traders use screeners to filter out high probability stocks ahead of indicators
  • How professional traders use with price-volume distribution in their trades
  • How professional traders use market depth to gain an edge in trading
  • How professional traders identify profitable stocks by analysing share ownership structure
  • How professional traders trade rights issue with warrants, bonus issue, stock split and share consolidation
  • Trading less and winning more: the best trading hours to suit your strategy
  • How to trade price cross over to a higher price band unique to Singapore stocks

We have already received enquiries for the next intake, which we plan to conduct in July. If you would like to register your interest, please send an email to my assistant Yunyou tanyunyou@phillip.com.sg. Kindly state your name, contact number, and a short description of your trading experience. We will keep you updated when the details are out! 

See you soon!


Best regards,
Robin Ho

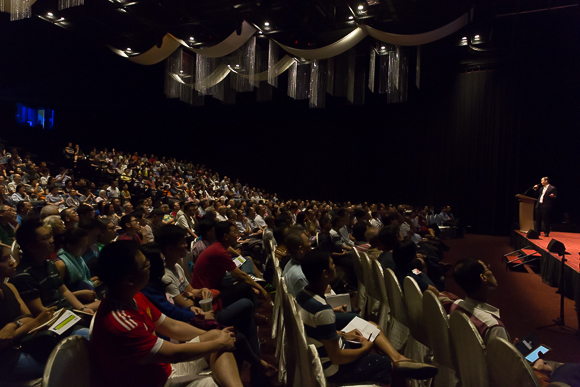
Class photo of the inaugural batch of "The Secrets of Short Term Trading" course.


All posts and charts are for educational and illustration purposes only

Gold Trade Plan

Traders took opportunity to ramp market up when Trump made its first maiden trip overseas as President. With Trump is back to office, the Russia and Comey issues my resurface to haunt the market Gold should benefit. A break above 1284 will signal a new upmove to 1315 and 1340.


All posts and charts are for educational and illustration purposes only
Monday, May 29, 2017

Market Outlook The Week Ahead

Stocks rallied after Trump made his first trip as president abroad, causing some to speculate that investor focus on the Russia probes may return when the president returns to U.S. The two most important data points on deck will be May consumer-confidence figures on Tuesday and the May jobs report . Of primary importance in the job figures, however, will be wage growth and productivity. The real number is wage growth, it’s not been growing as fast as it should Gold was strong last week despite fed indicating June rate hike is still on the cards.


All posts and charts are for educational and illustration purposes only

Palm Oil

Palm oil prices has fallen 20% since teh Jan and the recent rebound has fizzled out. This the prices continue to fall it will not augur well for the Palm oil stocks especially Golden Agri and Indo Agri. The quarter result may come in weaker.


All posts and charts are for educational and illustration purposes only

Alliance Minerals

Uptrend intact but likely to consolidate till end of the week before any further upside. Key resistance at 0.355. Any break above this level will be bullish.


All posts and charts are for educational and illustration purposes only
Tuesday, May 23, 2017

Noble

On 18 May this blog warned that the big boys have rammed the stock up and distributed between 0.705 and 0.715. Today the stock plummeted to 0.42 and trading was halted. S&P downgrade on its credit rating and Sinochem was reported to be no longer pursuing investment in teh company. This bad news brought in many short seller but trading was abruptly halted in the late morning. Many of these naked shorts will be subjected to the 'Buying-In Market' sometime after the stock resume trading. If no had news comes out from the 'trading halt', short covering could give the stock a much needed boast.


All posts and charts are for educational and illustration purposes only

IFast - Turned the corner

Turned the corner! Total asset under management grew faster than expected yoy to hit $6.46B. Next catalyst may come when their application for Trading and Clearing member to SGX is approval. technically the charts has broken out of its downtrend on exceptional volume. Next resistance is at 0.935 and 1.00. $1.17 could be the eventual target.


All posts and charts are for educational and illustration purposes only
Friday, May 19, 2017

Alliance Minerals

On 8 May when Alliance shot up from 0.3 to 0.38 on the news of take-off deal. This blog predicted that it should retrace to 0.3 before moving higher. The price action has unfolded according to my script. Looking forward, Alliance is expected to release the outcome of feasibility in its development of the 120-160 ktpa spodumene concentrate operation at Bald hill and its maiden (interim) resource estimate in May 17 which could be very soon. It should trade between 0.285 to 0.32 until the report is released. Any surprise upside to the resource estimate could cause the price to test 0.415.

All posts and charts are for educational and illustration purposes only
Thursday, May 18, 2017

Dow

On 12 May this blog said that Dow and Nasdaq chart has reached an inflexion point and a 20% correction could be expected. This blog believe yesterday's 372 points drop in Dow could be a start of this big correction which could take a month to pan out.


All posts and charts are for educational and illustration purposes only

Noble

The big boys might have unloaded between 0.705 to 0.715. Could retrace to next support at 0.62 in the short term.


All posts and charts are for educational and illustration purposes only
Tuesday, May 16, 2017

Jumbo

Chilli Crab is losing its flavour. 2Q17 earnings below expectation. Lower revenue in Singapore offset by Shanghai revenue. Gross margin was lower than expected. On the charts, it looks like heading for 0.555 in the short term, Longer term target is 0.485.


All posts and charts are for educational and illustration purposes only
Monday, May 15, 2017

Geo Energy

Reported revenue increased by US 87M or 735% from US 12M in 1Q2016 to US 99.3M in 1Q2017. Inspite of the stirling results the stock price fell to 0.285. Traders largely priced in the good set of results and are looking to weaker quarter with coal prices falling 25% from its peak in Apr 2017. The share price should test its support at 0.27 and consolidate there for a short while before heading for 0.24.


All posts and charts are for educational and illustration purposes only
Friday, May 12, 2017

Dow

Trump success in passing of Obamacare reform gives the market hope the tax reform will be passed more quickly and this hope has been holding up the US market. However more Fed rate hike and unwinding of central bank balance sheet posed a risk to the US market. Technically the DOW and nasdaq has hit critical chart point that historically are followed by 20% correction. The risk of holding US equities has heightened significantly in the last 2 weeks.


All posts and charts are for educational and illustration purposes only

ThaiBev,

Posted a 23% YoY decline in 2017 core profit. Twin woe of mourning period and higher marketing cost cause a bump in the profit. This could be a temporary effect. This blog believe 0.83 will be a good entry level for a rebound with 0.77 as a good investment buy.


All posts and charts are for educational and illustration purposes only
Tuesday, May 9, 2017

STI

More upside. Should be heading towards 3310 before a correction sets in.


All posts and charts are for educational and illustration purposes only

China Communications Construction Corp

One of the main beneficiary of China One Belt One Road Project. China will be holding the high profile OBOR summit in Beijing from 14-15 May. This stock may be in play as the summit may highlight the potential of this stock over this weekend.


All posts and charts are for educational and illustration purposes only
Monday, May 8, 2017

Jam-packed Morning at SGX Trading Symposium 2017

It was a jam-packed Saturday morning at SGX Trading Symposium as I shared with 500 participants about the life of a professional trader and some of the trading strategies I personally use in my trades. So here are some of the photos and slides. Keep following this blog and I hope to see you at my next event!


All posts and charts are for educational and illustration purposes only

Alliance Minerals

As the market digest the Off-Take news, Alliance is likely to drift down towards 0.30-0.305 level. Tawana dropped 5% today and its technical doesn't look promising. Key resistance remain at 0.35-0.36.


All posts and charts are for educational and illustration purposes only
Friday, May 5, 2017

SGX Trading Symposium 2017 - Customer Consent Form

Dear participants of Robin's talk at SGX Trading Symposium 2017, please fill in the form below to keep in touch and be updated of upcoming events. See you again soon!

https://goo.gl/forms/LNDNPmmqaCx6KDPW2

Customer Consent Form


All posts and charts are for educational and illustration purposes only

Shanghai A Share Index

The Shanghai A Share Index tracks the Bloomberg Commodity Index closely.


All posts and charts are for educational and illustration purposes only

Bloomberg Commodity Index

Bloomberg Commodity Index lost all its gains since Trump's ignited Reflation theme started in November 2016. There is growing concern whether Trump's pro growth reflation story has peaked. Iron ore price has dropped 32% from the peak reached in February. Rio Tinto is down 16% and Crude has fallen from a high of $54 to $45 this year. The Commodity Index has been a leading indicator of global economic growth and the stock market. If history is any indication, a correction in the stock market could be on the cards. The Bloomberg Commodity Index is sitting on its major support. A break below 82 will be bearish.
All posts and charts are for educational and illustration purposes only
Thursday, May 4, 2017

Singpost - Bottoming Out

Bottoming out process has started! A break above 1.415 will accelerate the price advance to 1.47 and 1.51.


All posts and charts are for educational and illustration purposes only

Advanced Trading Course - The Secret of Short Term Trading with Robin Ho

I will be conducting an advanced trading course to help aspiring traders get started with trading.You may be a new trader, or perhaps you have been trading for many years but there are many doubts which are holding you back, I believe you will benefit from this course! Just like everyone, I have been a new trader before, and hopefully I can shorten your learning curve by sharing from my 30 years of trading experience.

You will learn advanced intraday trading strategies, including:
  • Where and How to Find Stocks to Trade
  • How to Identify High Probability Patterns for Short Term Trading
  • How to Trade Fast Moving Stocks
  • How to Use Market Depth Analysis for Your Trades
  • Proper Trading Psychology, Discipline and Money Management

Course details are as follows:
  • Date: 27 May 17, Saturday
  • Time 900 am - 4 pm
  • Venue: 24 Raffles Place #20-06 Clifford Centre Singapore 048621
  • Lunch will be provided!
To register, click on this link to the course webpage: https://www.champcode.com/sstt/

See you there!


Robin Ho

Course Registration

All posts and charts are for educational and illustration purposes only

Alliance Minerals

Resumed trading today after a long suspension. Alliance's strong debut released the much needed liquidity into the speculative stocks market helping to lift the prices penny stocks. Alliance signed an exclusive lithium offtake agreement with a subsidiary of Burwill Holdings but the agreement is still subjected to certain conditions, including a mineral resource estimate of not less than 12000k tonnes with not less than 1.1% Li2O. Traders await for the resource estimate report which this blog believes will be the next catalyst for this stock to move higher. The short term support for this stocks remains at 0.35 and 0.33.


All posts and charts are for educational and illustration purposes only