Monday, December 28, 2020

Bitcoins - Why the macro uptrend has just begun.

Bitcoin’s break out to a new all-time high 25150 at the time of writing, the debasement of fiat currencies has resulted in Bitcoin becoming an increasingly viable “store of value” for the many institutions.

Microstrategy CEO Michael Saylor has bought $650 million worth of Bitcoin since December 11.

Big institutions who want to hedge against the debasement of fiat currencies are investing in BTC. This is particularly the case since custodian arrangements are now in place for owning Bitcoin offered by the likes of Fidelity.

In this respect, it is worth considering the numbers. The total market capitalisation of Bitcoin is now US$427bn which compares with the US$659bn market capitalisation of Tesla last Friday.


In America, Massachusetts Mutual Life Insurance Company announced on 10 December that it has invested 0.04% of its general investment fund, or US$100m, into Bitcoin. While in Britain, Ruffer Investment, a wealth manager, announced last week that it allocated 2.5%, or roughly US$15m, of its US$620m multi-strategies fund to Bitcoin in November. 


The latter investment in BTC is is interesting since has long being a conservative fund with emphasis on capital preservation.

Bitcoin is the only technology in our lifetime that enters the hypergrowth phase meeting up with shrinking supply.


Bitcoin (BTC)


All posts and charts are for educational and illustration purposes only
Wednesday, December 23, 2020

Tesla is easily the most sensational financial story in 2020. Will it last?

Tesla is easily one of the hottest tech stock in 2020. 


Shares of electric vehicle maker Tesla are up nearly 700 per cent over the last year, a meteoric rise has turned it into the world's most highly-valued automaker.


Is it too late to grab some ? 


With markets running up from its March lows, many would agree that Tesla is one of the most sensational performer. 

Tesla is now larger than the next five largest global auto companies (Figure 1) combined with a mammoth price-to-earnings (P/E) ratio standing at 1,278, according to FactSet data.


Given its gigantic size, Tesla could probably be a big macro driver of the market going into 2021 but is the valuations justified and will it be sustainable?

Looking at the earnings over the last 12 months, the S&P 500 was 26.79 times

Put it simply, investors have been willing to pay $26.79 for every $1 of earnings on an average S&P 500 component while Tesla investors are willing to shell out roughly $1,300 for every $1 of earnings produced by Tesla over the past year.

Apple potential entry into the auto industry could make a bearish case for Tesla

Morgan Stanley analysts see Apple’s rich ecosystem (deep pockets, capital access, ability to attract and retain talent and a large user base) as a strong basis of becoming a formidable opponent to Tesla than other auto-makers.

Should investors continue to plough into Tesla?

Now let us have a look at technicals and price action of Tesla on December 17, 2020, it hit the top of the trend channel and accompanied by high volume, a sign that  it has completed its trend channel cycle.

A similar price action was seen on February 3, 2020 where Tesla price hit the top of the trend channel at $194 before a correction of more than 36% to $70 on March 18, 2020.

If the same price action plays out,  I expect  an impending correction like that of February beginning to unfold in the next 20 days


All posts and charts are for educational and illustration purposes only
Friday, December 4, 2020
Total Global Stock Market Capitalisation is now closing in on US$100 trillion - it was closing in on US$60 trillion in March
This is why the stock market has gone through the roof, the whole lot of money printing, its visually shocking. We will have to face the consequences one day , the end will be detrimental.
US dollar will crash
The market will turn to Bitcoins and Gold will soar as seeks for safe haven.
All posts and charts are for educational and illustration purposes only
Thursday, December 3, 2020

Long Term Bearish on US Dollar

With the US presidential election now done with, and Joe Biden the president-elect of the US, we take a look this week at the US dollar and why I'm long term bearish on the reserve currency. 

Also, with this bearish view in mind, who are the potential beneficiaries of a weak dollar? 

Join me in my RHO Market Chat for more of my analysis!


All posts and charts are for educational and illustration purposes only
Monday, November 23, 2020

FTSE Straits Times Index (FTSE STI) 23 November 2020


FTSE STI hit last resistance at 2,839 (set on 09 June 2020). If FTSE STI continues its upward trend it could set to test the next resistance 2,894 (set on 09 March 2020).

If it fails to make a clear break above the 2,839 resistance, the immediate shelf of support will be 2705 – 2662 followed by 200 MA support at 2,620.

RSI momentum indicator shows that FTSE STI continues to trade at this week’s high, any short-term hesitation should be limited by this support zone between 2705 and 2662. A test and rebound off this support zone should lead to another test and potential break above the 2,839 and 2,894 resistance.

On the other hand, failure to hold above the 200-MA line would leave the market at best trapped in a trading range between the June highs and the September/October lows.


All posts and charts are for educational and illustration purposes only
Wednesday, November 11, 2020

Alibaba Group (NYSE:BABA) No Bottom In Sight.

Alibaba Group (NYSE:BABA) has broken below its 50-MA line and could be heading for 200-MA. There is a good chance of Alibaba Group hitting trendline support at 242 while its upside is capped at 295.

With China drafting up their first antitrust rules to curb power of tech companies, we probably could see more clarity these rules and its implications on Big Chinese tech companies beyond November as Chinese regulators are seeking public feedback until November 30. 

Resistance: 295

First Support: 268

Second Support: 254

Final Support: 242


All posts and charts are for educational and illustration purposes only
Friday, October 30, 2020

SunPower showed signs of bullish divergence today

With the  Dow Jones Futures Index down 500 points and STI falling by 23 points. 

SunPower showed signs of bullish divergence with unusual volume today. 

First resistance:  0.62

Second resistance: 0.635


All posts and charts are for educational and illustration purposes only
Wednesday, October 21, 2020

Top Glove (SGX:BVA) Trade idea 21 October 2020


Top Glove (SGX:BVA) has form a potential double top and has since retraced today to hit the first support at 2.88 and has bounced off its 50-MA. If this level is unable to hold it is likely to continue to move down to its second support at 2.70. 

Beyond 2.70 the next key supports are: 2.59 and 2.42.

Stop loss: 3.20

Key Resistance level: 3.163

All posts and charts are for educational and illustration purposes only
Friday, October 16, 2020

SATS (SGX: S58) Tailwinds emerging

An announcement was made today that Singapore and Hong Kong will create a travel bubble that exempts people from both cities from quarantine, an agreement that will re-open links between Asia’s two premier financial hubs. Since June 9 travel agreements have been signed to established Green Lanes with China South Korea., Japan , Indonesia and Brunei. 

I expect more approval to come. SIA recently introduced cruise to nowhere in flight dining saw huge demands and all these packages will benefit SATS  Arrivals at airports rose from 750 in April to 8912, no much to shout about compared to pre-covid numbers but certainly a positive development.

Opening-up is particularly important for Singapore to help reboot its economy and the aviation industries as Singapore relies heavily on international connectivity.

On the chart SATS currently trades above their 50-MA level. Immediate support at 2.95 and 2.85  with overhead resistance at 3.15 and 3.28


All posts and charts are for educational and illustration purposes only
Wednesday, October 14, 2020

Apple (NASDAQ: AAPL) - Hotly anticipated iPhone 12 launch fail to live up to its hype.

There was no fanfare at much anticipated iPhone 12 launch yesterday. In fact, Apple (NASDAQ: AAPL) fell by 2.65% on the news closing at $121.10 after trading to a high of S$125.39 yesterday. Pricing US$699 price is reasonable, but many analysts had more aggressive expectations. Pricing strategy has been critical to each iPhone’s success. This time I think the success of iPhone 11 is less likely to be repeated. With such high expectation and huge built up in component inventory, the high share price performance of Apple and its supply chain names may not be repeated in the next 6 months.
All posts and charts are for educational and illustration purposes only
Tuesday, September 29, 2020


Cosco Shipping (SGX: F83) "Every Dog Has Its Day"

Cosco Shipping Spore - "Every Dog Has Its Day" ... this stock has not seen daylight since 2011. 

Today, the price action is unusual with significantly improved volume indicating positive energy is back after a long time. Watch for the break above the downtrend line. Upon a breakout, the price could accelerate towards 0.22 its first resistance and 0.25 if a bit of luck. A break below 0.178 will negate all positive price action.


All posts and charts are for educational and illustration purposes only
Thursday, September 24, 2020

Tesla Battery Day Hype Disappoint.


Tesla Battery Day Hype Disappoint.

Tesla unveiled its much anticipated in-house technology amidst high expectation on battery day only to disappoint as management expects to halve battery price and ramped up

US$25,000 passenger electric vehicle in 3 year's time. The market was expecting game changer technologies such as silicon nanowire or single cathode material but there was no surprises.

On the chart Tesla price could have peaked for now and could be heading for the 50 Days MA at 358 before heading south again for the 338 level. The first credible support at 296 will be my first target and if the market condition deteriorates it could head for 273 which is my conviction support level .


All posts and charts are for educational and illustration purposes only
Thursday, September 17, 2020

Major Wall Street Indices could correct further


Major Wall Indices could correct further.

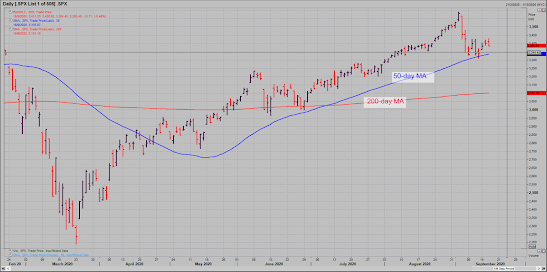
S&P 500/ Dow Jones/Nasdaq/ Russell 3000/Emerging Market Indices are trading close to its 50-day MA.

Will it break?

Normally, in an average bull market, investors should be buying when the asset class is supported above the 50-day MA as they  tend to rebound and go higher from this important technical level.

However, if you have watched my recent posting on how I called the Nasdaq top before its correction you will understand that the major Wall Street Indices have yet complete its corrective phase.

There could be more downside potential in the event that they break below their respective 50-day MA, they are likely to move towards their 200-day MA.

Nasdaq 100 Chart


Dow Jones Chart


 S&P 500 Chart


All posts and charts are for educational and illustration purposes only
Wednesday, September 16, 2020

Gold Is Taking A Breather

 Gold Is Taking A Breather

Fed promised to keep interest rates lower for longer, increased liquidity and its asset purchase policy to include corporate and municipal bonds have caused stocks  to skyrocketed to dot-com-bubble-like valuations.  And now, the Fed wants inflation to run higher to make up for lack of growth. ... Importantly, a lot of the first round of stimulus money – which started going out five months ago – still hasn't been spent yet and they are talking of more stimulus to come. Democrats and Republicans are to about to  approve another 500b to 1 trillion fiscal stimulus policy if the current  negotiation goes through.

More money printing as a form of payout will devalue the U.S. dollar and makes poor people poorer, whether they know it or not... leading to more calls for handouts.

That is why as far back as June 2019 , I have urged investors to own "hard assets" that will increase in relative value as the value of things priced in U.S. dollars goes down.

That concept is key to understanding how to protect your portfolio against inflation. Hard assets are things like gold, silver, property, art and cryptos.

The world only contains so much of these physical assets and when inflation is stoked by unlimited printing of fake money Gold and Gold companies will benefit.

Since hitting a new high of more than $2,070 per ounce in early August, the price of gold has retraced 10% and traded in a small range around $1,950 for the past month. It's trading up about 1% today, hovering around $1,965 per ounce as I write

When an asset retraced from high and consolidates within a 10% range it's a bullish signal. and that's exactly what gold is doing right now.

The dollar has been weak in recent months and if continues to go down it will be another catalyst for gold .

 Gold stock was one of the 5 stocks which Warren Buffet bought in recent filing.

Interestingly, Warren Buffet a long-time ‘critic’ of gold for having no utility, has invested in Barrick Gold (a gold mining company) this time around.

Here some reason Warren Buffet is invested in gold:

§   Gold serves as a defensive play

§  A safety hedge against the dollar in the event the dollar collapses.

Another reason behind Warren Buffet move could be that precious metals are known to do well during the very late stages of the market cycle often right before a market correction.

On the chart, Gold’s price action is bullish stay above is uptrend channel and supported by the 50 Days moving average

Gold is at an inflexion point , its worth keeping a close watch.


All posts and charts are for educational and illustration purposes only
Friday, September 11, 2020

Nasdaq 100 - Its Make or Break


The tech heavy Nasdaq index log its fastest move from record to correction in history . A correction  Is defined as a pullback that is 10% from the recent high. The question on everyone’s mind is “ is  this really the top for Nasdaq and  the Big Tech’s leadership of the US stock market, and the related unprecedented relative out performance of growth over value?

From my 30 years in the stock market  it certainly looks like one and the  recent events certainly fit the bill, be it stock splits by widely followed companies triggering euphoric retail-driven rallies (in this case Apple and Tesla) or the sudden exposure of  a so-called “Nasdaq whale”. The FAANG stock today make up of 25% of the S&P 500 market capitalisation. 

A week ago when Nasdaq 100 was trading near its all time high  I predicted Nasdaq 100 will take a correction to 11200 and that was exactly what happened when the index fell from its high from 12439 on 2 Sep to 11145 on 4 Sep.

Will this 10 % correction turn into a 20 % correction with is the definition for a bear market . Well , tonight could be the make or break according to my trade plan. A break below 11050 will could trigger more downside and if prices stay above 11200 the uptrend could  stay intact. 

 .

All posts and charts are for educational and illustration purposes only
Thursday, September 10, 2020

AEM (Fundamentals Remains Intact But The Price Action Is Signalling A Potential Correction)


AEM - Fundamentals remain intact but the price action is signalling a potential correction in the near term. The price currently sits of the uptrend line and the 50 Days MA. A break below these levels could trigger downside target to 3.45 and 3.01. 


All posts and charts are for educational and illustration purposes only