Monday, October 31, 2022

The Hang Seng Index, traded to a low at 14597 points on October 31 Oct . This is a 55 percent drop from its lifetime high of 33,154 points that it closed at in January 2018 and now. What went wrong?

China, the world’s second largest economy has seen its economy tapering off, through the supply chain disruptions caused by brutal and rolling lockdowns caused by the China Covid suppression policies and sweeping changes to its mega tech companies. President Xi Jinping earlier this month was re-elected to power for a third term and appointed his allies in key positions of power further raised concern about the strengthening of government control over the economy and companies operating in China. Xi’s emphasis on “Common Prosperity”  indicate that the regime is leaning more towards a leftist ideology. There is no clarity whether the regime will support capitalism or free-market forces to the extent they have done in the past


But in the midst of this doomsday-like outlook, compared to 28,543 points on January 2, 2020—just as COVID-19 had started to spread—the Hang Seng traded to today’s low at 14597 is making its valuation compelling . The price to earnings multiple, a measure of valuation, has come down to 5.3 times from 16 times over the same period.  Though the valuations are attractive but investors  still lacks understanding of how things are changing on the ground and are choosing to wait for more clarity before jumping in.


Something Caught My Eye Today

The Hang Seng Tech Index ETF (3032.HK) which tracks the Big HK Tech Companies has shown sign of capitulation on unprecedented trading volume on 24 Oct which is a indicator of investor’s throwing in their last towel. The epi centre of the HSI decline has been the HK tech stocks and we are seeing some sign of short term bottoming.  There is a good potential for a 10 to 15% rebounding coming soon . 3032.HK trades at 2.89, a rebound to 3.18 to 3.40 could be on the cards in the short term 


All posts and charts are for educational and illustration purposes only
Tuesday, June 28, 2022

BYD (1211 HK) "Sky is the limit"

BYD continues to deliver resilient EV sales thanks to a strong model line-up, vertical integration and leadership in LFP batteries.


Global EV sales remain resilient as car makers are prioritising EVs and China policies remain supportive amid the energy crisis.

BYD is a battery makers with technological leadership and cost competitiveness that will help to alleviate margin pressure caused by material inflation.

BYD is breaking above its all time high of 324.60 today and will enter a path of least resistance and the "Sky is the Limit", next target 350 and 367.


All posts and charts are for educational and illustration purposes only
Wednesday, June 15, 2022

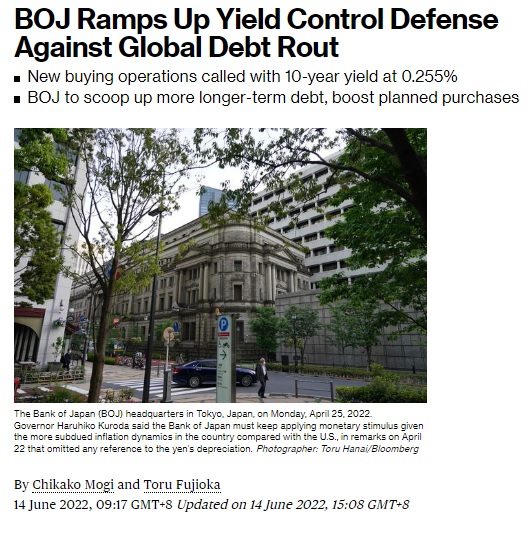
BOJ Ramps Up Yield Control Defense Against Global Debt Rout

I don't think the Japanese central bankers can hold out any longer.


Start shorting Japanese government bonds, betting the Bank of Japan will be forced to abandon its super-easy monetary policy that's increasingly isolated from global peers.


The Japanese market will crash along with the bond market when liquidity is tighten. This could be the trigger for the next big crash.


Start shorting the Nikkei, it could happen soon!


All posts and charts are for educational and illustration purposes only
Monday, June 13, 2022

Is decline in yen due to carry trade ? Or is the market questioning the credibility of the Japanese central bank indiscriminate money printing policies.

Usd/Yen - Since I posted my bearish views of dollar / yen on 12 Apr when it was traded at 125.4 and had a target of 134 and 147 , the first target has been hit today, frankly it came sooner than I thought.

The sell-off in the Treasury bond market over the past two weeks, with the 10-year Treasury bond yield rising from 2.70% on 26 May to 3.02%, has predictably triggered renewed downside pressure on the yen and as long as the US treasury yields continue to go higher it will cause the yen to decline further .

What is the key issue here for investor? Is decline in yen due to carry trade or is the market questioning the credibility of the Japanese central bank indiscriminate money printing policies.

How the yen behaves in the next downturn is the crucial issue on which investors need to be focusing.

If the yen hits my next target at 147, it will be unusual signal worth paying attention to and potentially a signal that the monetary madness of the previous decades is seeing its first credible market signal that it will no longer be tolerated.

It could lead to the next Global Financial crisis.


All posts and charts are for educational and illustration purposes only

Glad to be featured as a part of the APAC Trader’s Summit line-up held on Saturday (11 June 2022).

Just in case you missed this it’s just up on YouTube. Tips and tricks dropped!


If you missed the event this is the recording ➡️ https://youtu.be/HhRvZYwDPF0


All posts and charts are for educational and illustration purposes only
Tuesday, June 7, 2022

Bloomberg Commodity Index poised to challenge the year's high after a 3 months consolidation.

Commodity super cycle typically last between 7-10 years , this cycle is 2.5 years old. 

Congrats to those who invested in the commodity unit trust under my management since mid 2021 , we are  outperforming every asset class. Ride this mega trend!


All posts and charts are for educational and illustration purposes only
Monday, May 30, 2022

WTI Crude Oil - WTI is poised to break out of its 3 months consolidation


WTI is poised to break out of its 3 months consolidation as Shanghai allowed manufacturers to resume operations from June and Beijing's coronavirus outbreak is under control.

WTI will hit 130 when it breaks above 117 and a longer term target of 147 if WTI is able to stay above 130.

All posts and charts are for educational and illustration purposes only
Sunday, May 29, 2022

Inflation finally slows! Does that mean that the market has found its bottom?

Inflation finally slows! 

Wall Street closed sharply higher as signs of peaking inflation and consumer resiliency sent investors into the long holiday weekend with growing optimism that the Federal Reserve will be able to tighten monetary policy without tipping the economy into recession. Does that mean that the market has found its bottom?


In the 12 months through April, the PCE price index advanced 6.3% after jumping 6.6% in March.


The annual PCE price index increase is slowing as last year's large gains drop out of the calculation.


Excluding the volatile food and energy components, the PCE price index gained 0.3%, rising by the same margin for three straight months. The so-called core PCE price index increased 4.9% year-on-year in April, the smallest gain since last December, after rising 5.2% in March. It was the second straight month that the rate of increase in the annual core PCE price index decelerated. This inflation measure is the most followed by economists and policymakers.


Inflation past the peak?

Inflation has pass the peak but it will remain stubbornly high. I remain confident that crude oil recent consolidation is getting ready for another parabola spike up to 140 d/b. 


Substantial declines in the annual rate of inflation are unlikely to materialise until there are significant improvements in geopolitical tensions (that would get energy prices lower), supply chain strains and labour market shortages. Unfortunately, there is little sign of any of this happening anytime soon – The Russia-Ukraine conflict shows no end in sight, Chinese lockdowns will continue to impact the global economy. 


At the moment consumer demand is firm and businesses have pricing power, meaning that they can pass higher costs onto their customers. 


Housing will keep inflation high 

The housing components, accounting for more than 30% of the CPI basket, are not likely to turn lower soon. The housing market remains red hot and this feeds through into primary rents and owners’ equivalent rent (OER) components of inflation with a lag of around 12-18 months. 


Rent contracts are typically only changed once a year when your contract is renewed so it takes time to feed through.


Fed under political pressure to curb inflation 

This situation intensifies the pressure on the Fed to hike interest rates. This potentially means aggressive rate hikes and the risks of a marked slowdown/recession.


The Federal Reserve remains, for now at least, under political pressure to tighten  with the  poll this month which shows that Americans remain far more concerned about inflation than any other issue. A total of 70% of Americans view inflation as “a very big problem”


And the empirical evidence shows that the Fed in the post-Volcker era has been increasingly sensitive to such political pressures. It is certainly not  easy for Fed to talk dovish when the executive and legislative arms of government want to curb inflation as a top priority especially ahead of the mid term election.


All posts and charts are for educational and illustration purposes only
Tuesday, May 24, 2022

Valuation Looks Compelling But Is It Time To Buy?

Time to start buying ? Valuation is tempting  after the meltdown.

US shares took at beating with Nasdaq 100 down 30 % and S&P testing the 20% bear market benchmark.  Valuation looks compelling but is it time to buy?

United States Private Consumption accounted for 68.3 % of its Nominal GDP in Mar 2022. 

Shares of U.S. retailers and consumer-oriented stocks took a beating last week on worries about whether surging inflation will continue to hurt corporate bottom-lines and cause shoppers to cut back.

Last week, consumer staples dived 8.6% and consumer discretionary tumbled  7.4%, the biggest declines of any S&P 500 sectors, with inflation hammering corporate results. Shares of some companies fared far worse, with Walmart down 19.5% for the week and Target down  29% after disappointing results. 

We are beginning to see Investors consumers cut spending in the face of higher prices. This is happening sooner than what most on Wall Street are anticipating .

I think we are only at the beginning of people cutting down spending  and changing their spending patterns.

The latest consumer price index jumped 8.3% on an annual basis. Prices for gasoline stand more than 50% higher than a year ago, according to AAA.

Gasoline prices are scaling new high while oil prices has stubbornly stay above the 100 dollar/ barrel mark will keep undermining consumer spending.

A survey by Morgan Stanley found that more than half of consumers plan to cut spending over the next six months due to inflation.

The  slump in share prices has made valuations and risk/reward more tempting but we to see evidence of ebbing inflation before we start bottom fishing .  

Private consumption makes up 68 % of the US economy , when consumer cuts back spending US and the world is going into recession. This bear market has more downside , it’s not time to get  into stocks yet .

All posts and charts are for educational and illustration purposes only
Sunday, May 15, 2022

Robin is pleased to announce the launching of RHO DLC Trader Group and RHO DLC Discussion Telegram Group (15 May 2022)

To help out those who are keen but new and inexperience in trading DLCs, Robin is pleased to announce that he will be launching two new telegram chat groups where he will be sharing his DLC insights and trade ideas.


Robin has been actively involved with Societe Generale (SocGen) in the promotion of DLCs since it was first launched on SGX in 2017. He regularly featured as a guest speaker and strategist in market outlooks and seminars held by SocGen to promote DLCs as a financial tool to profit from the markets.

The leverage factor of DLCs means price movements can be very volatile depending on the nature of the underlying asset. Therefore, having a trading veteran like Robin with vast experience in trading DLCs and stocks is essential to guide those who are new and inexperience to achieve success trading DLCs.

Robin has a strong conviction that DLCs are useful for both traders and investors in Singapore to generate exceptional returns.

RHO DLC Traders Group RHO
One-way communication telegram chatgroup catered for participants who wish only to listen to Robin’s DLC post and trade ideas.

RHO DLC Discussion group
Is a two-way communication telegram group catered for those who want to discuss about DLC and passionate about sharing DLC trade ideas.
The chat groups provide a platform for participants to express and contribute their opinions/views of the market as well as promote interaction amongst members with an opportunity to learn from one another’s success and mistakes.
The content posts for both DLC Chatgroups are the same. Robin will prioritise his posts in RHO DLC Traders Group.

Benefits of joining the RHO DLC Chatgroup/(s):
• Detailed Trade Plans of Specific Stocks and Market insights
• Market moving news alerts
• Bite size DLC education feeds
• Updates on newly launch DLCs

How to register?
Kindly click on the link to fill up the registration form:
Both RHO DLC Chat Group activities to commence on 17 May 2022 (Tuesday).

About Robin Ho:
Robin is one of the most active and successful traders in Phillip Capital. He is also amongst the top Trading Representatives, taking care of about 2000 clients with more than $50 million of assets under custody. His flagship Unit Trust advisory service is highly sought after by clients who wants an experienced hand to manage their funds. The model portfolio has achieved stellar returns over the past one year since it launched.

He became a well sought-after speaker after turning $100,000 into $2 million in 15 months during the 2008 Global Financial Crisis. Institutions such as Singapore Exchange (SGX), Societe Generale DLC, Macquarie Warrants and Phillip CFD have partnered with him on various projects, including seminars, weekly market analysis, market outlook conferences and trader fairs, bringing professional knowledge to the retail investors.

His views are also highly sought by the media, such as The Business Times, Lianhe Zaobao, The New Paper, Wo Bao and The Borneo Post.

For more than 15 years, he has trained thousands of students, including professional traders in his signature Price Action Trading Course. It is one of the longest running courses in Singapore which is constantly updated according to the ever-evolving investment landscape. It is also famous for its live trading session in which participants put their newly acquired skills into practice. Since 2012, he has been appointed as a professional trainer with SGX Academy.


All posts and charts are for educational and illustration purposes only
Wednesday, May 11, 2022

What You Need To Know About This Bear Market

Dow and S&P are racing to bear market territory. 


Watch for 20%: Market cycles are measured from peak to trough, so a stock index officially reaches bear territory when the closing price drops at least 20% from its most recent high (whereas a correction is a drop of 10%-19.9%). A new bull market begins when the closing price gains 20% from its low.


I have learnt in my 35 years in the stock market that when the macro turns and the market corrects, the weak get weaker. 


Always choose to short the weaker sector like the Nasdaq and Russell because they fall faster . 


Dow Jones is down 13% from the peak, S&P 500 17.5% , Nasdaq 100 down 27.6% and Russell 2000 down 28.6% from its peak 


Stocks lose 36% on average in a bear market. 


We are not there yet.


Bear markets tend to be short-lived. The average length of a bear market is 289 days, or about 9.6 months. 


We are not there yet.


Every 3.6 years: That’s the long-term average frequency between bear markets. Though many consider the bull market that start after the great financial crisis in 2008 and ended in 2021 to be the longest on record. 


Here’s is the danger , the longest bull market may begat an exceptionally long bear market much longer than the average 289 days .


This bear market still has Legs to go further and longer .


All posts and charts are for educational and illustration purposes only
Tuesday, May 10, 2022

Amazon (Nasdaq: AMZN) - Well defined long-term trendline that stretches back to 2017 is suggesting that Amazon heading lower towards 2215 and prehaps 2035.


On 2 May 2022 (Monday), this trade plan on Amazon (Nasdaq: AMZN) was posted on my Telegram Stock Chat Group when the stock was at 2,485. 


Last night, Amazon (Nasdaq: AMZN) traded at a low of 2,159 (down more than 5%) and has hit my first target at 2,215 before closing at 2,175. The stock is down more than 12% since this trade plan was posted.

All posts and charts are for educational and illustration purposes only

Russell 2000 Index (10 May 2022)

On May 6 2022 (last Friday), this trade plan on Russell 2000 Index was posted on my Telegram Stock Chat Group when the index was at 1,871.


The trade plan reflected a short-term profit potential of about 150 points (with an immediate target price at 1,726).

Last night, Russell 2000 Index traded at a low of 1,754 (down more than 4%) nearing my target before rebounding to close at 1,762.


All posts and charts are for educational and illustration purposes only

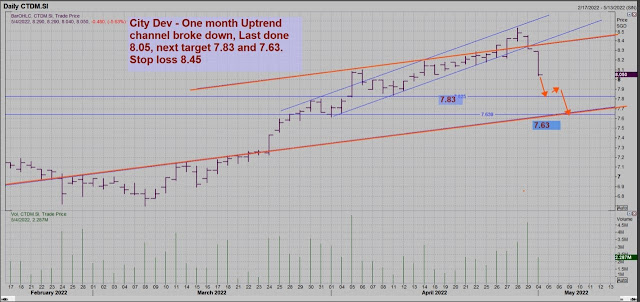
City Dev (SGX:C09) – One month uptrend channel broke down.

On May 4 2022 (last Wednesday), this trade plan on City Dev (SGX:C09) was posted on my Telegram Stock Chat Group when the stock was at 8.05.


City Dev (SGX:C09) traded at a low of 7.88 (down more than 2%) this morning.

Last trading at 7.93. Next target at 7.83 and 7.63. Stop loss at 8.45.


All posts and charts are for educational and illustration purposes only

This Is Why I Continue To Believe This Bear Market On Growth Stocks Is In Its Early Innings

TINA - A common refrain since the March 2009 market low has been “there is no alternative” (TINA) — a catchphrase used as justification for buying stocks amidst ever higher price-to-earnings multiples where treasury yield are close to zero . 


Benchmark Treasury yields definitively broke above 3%, moving further above their four-decade downtrend which intimates a new era has begun. A cold look at the long-term chart shows the next obvious stop should be around 4% The higher yields go, the more appealing they become for many investors and increased fears of a global recession suggests that some may soon consider returning to bonds. 


Tina has reversed so has the “buy on dip strategy”. In the recent months “ Sell into strength”  has overtaken  “buying into dip” as a dominant and profitable  strategy . The  continuing weakness of the Treasury bond market, in the face of a hawkish Fed, is the best evidence of stagflationary concerns. It has also reconfirmed the death of risk parity with bonds and equities both down year to date in America. The S&P500 has declined by 9.4% on a total-return basis year-to-date, while the Bloomberg US Long-term (10Y+) Treasury Bond Index is down 19% . The longer this state of affairs continues, the more likely it is to trigger severe collateral financial damage somewhere. A Hawkish Fed  trying to regain credibility remains plain bearish for growth stocks which is why, I have been so bearish on Nasdaq. The forward price-earnings gap between the MSCI AC World Growth Index and its value equivalent has come back down to around 10 points, having reached as high as 16 points in January last year. The bad news is that the long-term average valuation gap between global growth and value shares is about 5 P/E points, something which suggests the premium still has room to shrink even further.


Another danger lurking on  the horizon for  equities is a growing risk of mass redemptions from ETFs with the sell-off exacerbated by the reality that everybody owns the same stocks (Fanngs) because of the socialist monstrosity know as passive investment or “indexation”. This is why I continues to believe this bear market on Growth stocks is in its early innings .


All posts and charts are for educational and illustration purposes only
Wednesday, March 23, 2022

BABA (HKEx:9988) Hit Trend Channel Resistance, Could Pull Back.

Alibaba has hit short-term trend channel resistance today at 117.60 HKD.

Could correct to support levels of 114.15, 109.13 and 104.41 in the short term. 


All posts and charts are for educational and illustration purposes only
Tuesday, March 22, 2022

WTI Crude Correction Could Be Over, Uptrend To Resume

Yesterday, I posted my trade plan on WTI Crude Oil in my Telegram Stock Chat Group when WTI crude was at 108.

Today, WTI Crude futures surged to high of 115 (up more than 2%) hitting my first target . The correction for crude could be over, and it’s poised to challenge the last high at 130.


When WTI crude corrected from 130 to 93, a lot of traders shorted the crude with a view that it had peaked . If the prices challenge the 125 mark it could trigger massive short covering that will take WTI crude to 147. 


All posts and charts are for educational and illustration purposes only
Wednesday, March 16, 2022

ISDN (SGX: I07) Bearish Price Action - H&S Formed With 50-MA broken)

ISDN form head and shoulder pattern last November. The stock continued to trade weaker thereon and broke below its 50 day-MA in Feb 2022. ISDN price is on a downtrend since.

The stock last traded at 0.575
Immediate Resistance: 0.615
Second Resistance: 0.715
Cut Loss: Above 0.74
Target 1: 0.535
Target 2: 0.45

Target 3: 0.385


All posts and charts are for educational and illustration purposes only
Friday, March 11, 2022

How RHO Trade Plan correctly call a sell on DBS (SGX: D05) near its peak and took profit close to the recent bottom.

DBS hit a peak at 37.49 on 14 February.
RHO Trade Plan identified the start of a downtrend on 25 February and a short call was made at 34.95.
Using RHO propriety price action strategy, we identified our profit targets and cut loss levels. They were spot on, with DBS hitting three out of the four targets set out in the trade plan (gaining more than 11% in slightly more than 1 week).
What’s more? When the third target at 31.05 was hit, DBS pull off a sharp rebound, and we then took all our profit.
In a volatile market like this, it’s so important to understand how to create a good trade plan to identify precisely when to enter and exit your trade.
To find out more about Robin’s proprietary trading strategy, email tanyunyou@phillip.com.sg.
To get first insight into Robin’s trading idea and live market analysis join RHO live-stock chat group. Email Robin at robinhosa@phillip.com.sg.
For account opening, you can click on the link provided: https://blog.robinhosmartrade.com/.../join-robins-trading...


All posts and charts are for educational and illustration purposes only
Monday, March 7, 2022

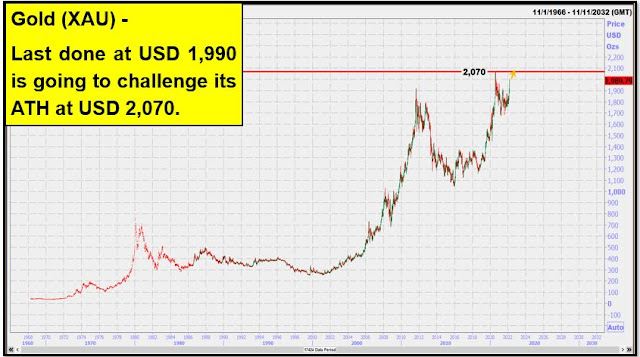
Gold last done at USD 1,990 is going to challenge its ATH at USD 2,070.

These are the reasons:

* Gold is both a safe haven asset and an inflation hedge. We are in the middle of these conditions.
* War is defining movement throughout financial markets
* Inflation is a big concern. War stoking prices.
* Gold has been largely ignored during wider pandemic driven commodity gains.


All posts and charts are for educational and illustration purposes only

WTI Crude is heading for all-time high at USD 147.

Russia is the world’s largest exporter of oil to global markets and the second largest crude oil exporter behind Saudi Arabia. US and it’s European allies are mulling over the imposing sanctions on Russian oil .

If it happens , oil will sky rocket above is ATH as the sanction could exacerbate the current tight supply conditions.
Furthermore, OPEC Plus declined to take steps to cool the market at their recent meeting while Russia’s invasion of Ukraine rattles markets sends the price of crude skyrocketing.
What seems to be a ray of hope to the Iran Nuclear deal , after months of negotiations , a revised deal was expected to be reached within days under which US sanctions would be lifted in return for Tehran returning to full compliance with the 2015 nuclear nonproliferation deal.
But diplomatic efforts have been sent into a tailspin by Russia’s unexpected demand for written guarantees that its economic trade with Iran will be exempted from US sanctions imposed on Russia since its invasion of Ukraine.
Gulf states sees constraint supply with soaring prices as an as an opportunity to balance their books which potentially could send Crude Oil futures surging towards their all-time high at $147.


All posts and charts are for educational and illustration purposes only
Thursday, March 3, 2022

Commodity Supercycle is Accelerating Higher

 The Bloomberg Commodity Index broke out from its uptrend channel to hit a 124 high today.

The 1st target at 131 is approaching but before the year end it should hit 175. Stay invested in commodity stocks especially crude oil.


All posts and charts are for educational and illustration purposes only