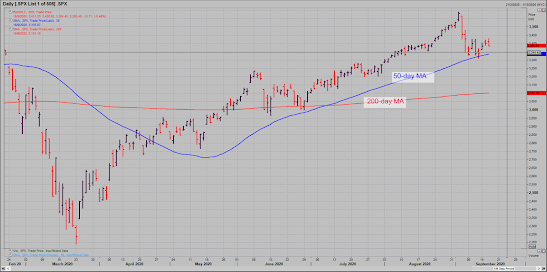
Major Wall Indices could correct further.
S&P 500/ Dow Jones/Nasdaq/ Russell
3000/Emerging Market Indices are trading close to its 50-day MA.
Will it break?
Normally, in an average bull market,
investors should be buying when the asset class is supported above the 50-day
MA as they tend to rebound and go higher
from this important technical level.
However, if you have watched my recent
posting on how I called the Nasdaq top before its correction you will
understand that the major Wall Street Indices have yet complete its corrective
phase.
There could be more downside potential in
the event that they break below their respective 50-day MA, they are likely to move
towards their 200-day MA.
Nasdaq 100 Chart
Dow Jones Chart


No comments:
Post a Comment
Note: Only a member of this blog may post a comment.