Thursday, February 6, 2020

Talking to Young Investors at SIT

On Monday, I was invited by SIT Investment Club to talk to "Let's Talk about Money". This is a financial literacy initiative in collaboration with Doctor Wealth. 

I gave the students an overview about the different type of assets to get started on their investment journey. We also looked into real life examples of different kinds of stocks, such as growth stocks, income stocks, speculative stocks, and how to avoid the pitfalls many investors made so that they can start off in the right way.

To encapsulate my points in one picture, I showed them an illustration of a hamburger. It sums up how they can start building their portfolio with sound asset allocation. 

Instead of diving straight into stocks, a young investor can consider starting with a saving plan which gives predictable returns to form the foundation of their retirement income. 

Insurance is key to and should be budgeted well so that it gives adequate protection and also leaves them with sufficient cash flow to pursue their personal growth.

Finally, when they have accumulate sufficient capital, they can look into deploying their funds into a portfolio of stocks, bonds etc. 

Knowledge is power! I hope all of us will continue learning every day.

For enquiries about how to optimise your assets allocation, email us at 


All posts and charts are for educational and illustration purposes only
Friday, January 31, 2020

Wuhan Coronovirus Epidemic - When Will The Stock Market Bottomed Out?

The first outbreak on 6 February 2003, and bottomed out  25 April. A strong rebound followed and the indices ended the year higher. MSCI Hong Kong and Hang Seng Index in 2003. Expert say that this virus is less fatal but more infectious and indeed it took only 8 months for SaRs to spread to 8000 people. The Wuhan virus infected 8100 people in 30 days. The fast spreading virus has so far only impacted travel and tourism but the outbreak will inevitably cause supply chain hiccup and near-term earnings decline for tech firms with exposure to China. Chinese companies will suffer more than foreign ones. We could also see a delay in China’s 5G deployment and PC and smartphone production trouble. One company that will inevitably suffer is Lenovo Group 0992.HK, almost 60% of their smartphone production comes from factories in Wuhan.  Drawing lessons from SARs , we are probably in the early days of the epidemic and nobody at this stage could fathom the depths of economic damage it can inflict. It took Hang Seng about 2 months to recover from SARs , it may take longer this time . If what the expert say is true , this virus will strike more fear because it is fast spreading and this  will cost many companies to suspend business which will be detrimental to the economy and the stock market. The markets in US seems immune to the virus but i believe the damage will eventually  find its way to the American shore . 
All posts and charts are for educational and illustration purposes only
Sunday, January 26, 2020

Coronavirus Epidemic - Note to Traders

Wall Street Street has been largely immune to the China Corona virus epidemic. Perhaps because history shows it does not pay to be bearish.

According to Dow Jones Market Data, the S&P 500 posted a gain of 14.59% after the first occurrence of SARS back in 2002-03, based on the end of month performance for the index in April, 2003. About 12 months after that point, the broad-market benchmark was up 20.76%.

However, I think this time round it could be different. Beijing is  more important to the world economy now than in 2003, lock down to more cities, restricting movement to an unprecedented 56 million people as it rushes to build a prefabricated, 1,000-bed hospital for victims.

The ability of the virus to halt travel and harm consumption, particularly in Beijing, are some of the ways an outbreak could have economic implications that could wash up on U.S.

The fact that the coronavirus came as a full surprise, has the potential of having a major effect.

Goldman Sachs said in a note on Tuesday it anticipated a 260,000-barrels-per-day negative shock to global oil demand on average, including a 170,000-bpd loss of jet fuel .

For me , the strategy is to Sell Now, Worry Later, while traders may not yet grasp the full impact of the coronavirus, oil bulls already wavering in their conviction, oil prices hit nine-week lows on Thursday, with U.S. crude down 9% on the year while Brent, the global crude benchmark, sunk 6%.

Stay bearish until we see the cases of people infected start decreasing.

This coronavirus epidemic could turn out to be a Black Swan event.

Holding some gold as a defensive hedge could be a good idea.

Have a blessed and happy CNY!
All posts and charts are for educational and illustration purposes only
Saturday, January 18, 2020

Thank you for your support!

My heartfelt thanks to everyone who have supported and journeyed with me for yet another year. The success of RHO intra-day index trading signal was a significant milestone in my life. I am especially heartened because it has helped many retail traders with limited capital to make an income. The RHO signal was special because it is probably the only trading signal in the world that gives live calls for major global stock indices on a intra-day basis. Day trading is the most challenging type of trading traders face today and RHO signals has successfully and consistently provided good wins. I am committed to helping retail traders gain an edge over the market. This year, I forward to launching the RHO Swing and RHO Quick Win signals (a very short term trade signal) for stocks. This is something I have been working with my team for the last 3 years. For those who are current running this race with me, please stay with me, the best is yet to be! I wish everyone a great 2020 with many blessings!


All posts and charts are for educational and illustration purposes only
Thursday, January 16, 2020

Intra Day Trading with RHO Signals

Intra-day trading is challenging, but with a system to track your positions for you, it can be more efficient, and profitable!

Last night our system triggered two trades for Dow Jones, yielding 450 points profit intra-day.


Today, our system managed to catch Hang Seng Index at the peak, yielding approximately 405 points intra-day.


To experience a more systematic way of trading, go to www.tradingkungfu.com/keylevels.
All posts and charts are for educational and illustration purposes only
Wednesday, January 15, 2020
Tuesday, January 7, 2020

Gold - A New Bull Cycle Has Just Begun

Gold - When Gold broke above 1340 in Jun 19 , i declared a New Gold bull cycle has started . After Gold shot pass 1340 i predicted on my blog that it will hit a high of 1550 in Sep 19.  Yesterday Gold prices surpassed the target to close at a 6 years high of 1588. I believe the metal is  in the cusp of early New Bull cycle and there is more room to run. If Gold can stay above 1588, the next target will be 1654 and to complete this cycle the metal will have to achieve the 1704 target
All posts and charts are for educational and illustration purposes only
Tuesday, December 31, 2019

Broadway Industrial - Signs of Exhaustion


On 27 January, I cautioned that Broadway Industrial Group's recent rally may be running out of steam at 0.15. This morning it fell to a low of 0.127. This is a proprietary trading signal that I have been using to spot market top and bottom and it has worked so well with Broadway Industrial Group.


All posts and charts are for educational and illustration purposes only
Monday, December 30, 2019

SGX Lunchtime Seminar

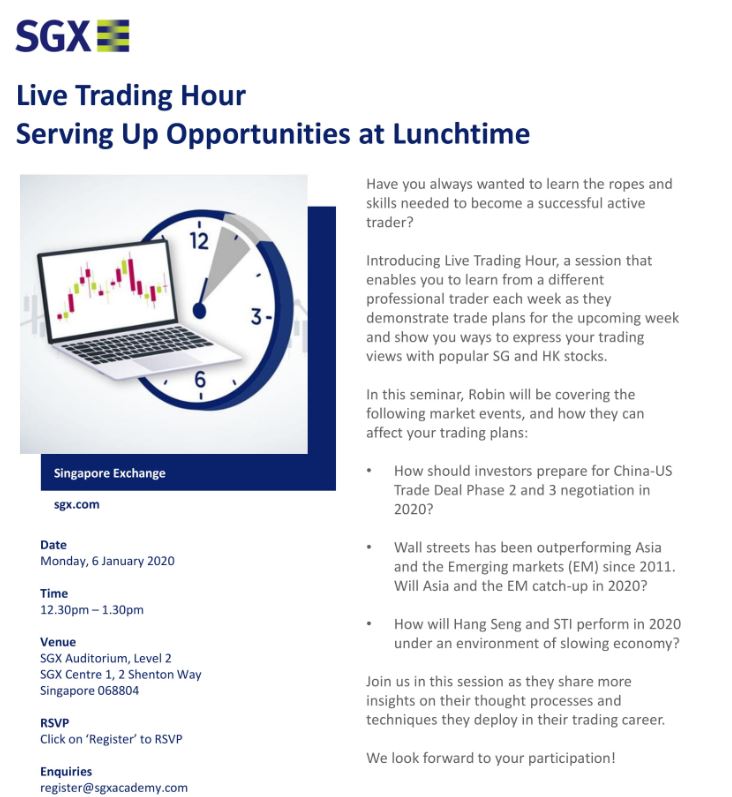
I will be speaking at SGX lunchtime seminar next Monday, 6 Jan 2020, hope to see you there! https://www.sgxacademy.com/event/live-trading-hour-serving-up-opportunities-at-lunchtime-5/


All posts and charts are for educational and illustration purposes only
Friday, December 27, 2019
Thursday, December 19, 2019

McKesson - Legal Troubles

Pharmaceutical distributor McKesson (NYSE: MCK) remains in the spotlight for its role in the opioid epidemic. Earlier this month, McKesson agreed to settle a lawsuit with the state of West Virginia for $37 million. The lawsuit claimed that the company flooded the market with highly addictive narcotics and misled the public. This is just one of a multitude of settlements we expect McKesson to pay going forward. McKesson estimates opioid litigation alone will cost it $100 million in 2019 and $150 million per year starting in 2020. This litigation will only grow from here.

First posted on Facebook https://www.facebook.com/groups/rhosignals/


All posts and charts are for educational and illustration purposes only
Monday, December 9, 2019

Testimonials from Students of Robin's Trading Course (Nov 2019)

Last week, we concluded our final 6 days intensive trading course for 2019! Through 3 weeks of the course, some of the participants have managed to profit from the trade plans they did together in the class and earned back their course fees. Hope to see you at the next intake!


All posts and charts are for educational and illustration purposes only
Tuesday, December 3, 2019

S&P 500 - Flashing Red

S&P 500 could have topped out and could be heading for a huge correction.


All posts and charts are for educational and illustration purposes only
Monday, December 2, 2019

SGX – Breaking Out Of the Range


  • Recent price action triggers a bullish implication of a multi year basing pattern and breaking out of the 2016-2018 trading range between 6.80 to 7.70 adds more evidence to the upswing cycle.
  • Breaking above resistances at 8.50 and 8.80 will set the stock for another swing up to its next upside target at 9.60.
  • Staying firmly above its 200 days moving average since early 2019 confirms the uptrend is intact.
All posts and charts are for educational and illustration purposes only
Friday, November 29, 2019

UOB - Trading within a Range


  • UOB is trading between the range 24.30 to 27.00. After touching 27.00 level in early November it has retraced to its 200-day MA support level.
  • The current pullback could continue towards the next support at 25.4.
  • A break below 25.40 could trigger a downward move toward 24.30 which will offer an opportunity to accumulate new long position in anticipation of a rebound.
All posts and charts are for educational and illustration purposes only

PetroChina – Downtrend Intact


  • PetroChina is still a significant underperformer within the China A50 index stocks as price action maintains a series of lower highs that has formed since November 2018.
  • Today it broke its 3.70 support and if it stays below this level, it could test the next support at 3.44 in the short term.
  • It trades significantly below its 200-day MA and the longer price objective points to a target of 3.11.
All posts and charts are for educational and illustration purposes only

Hang Seng Index - Middle Of The Range But Expect A Corrective Pullback

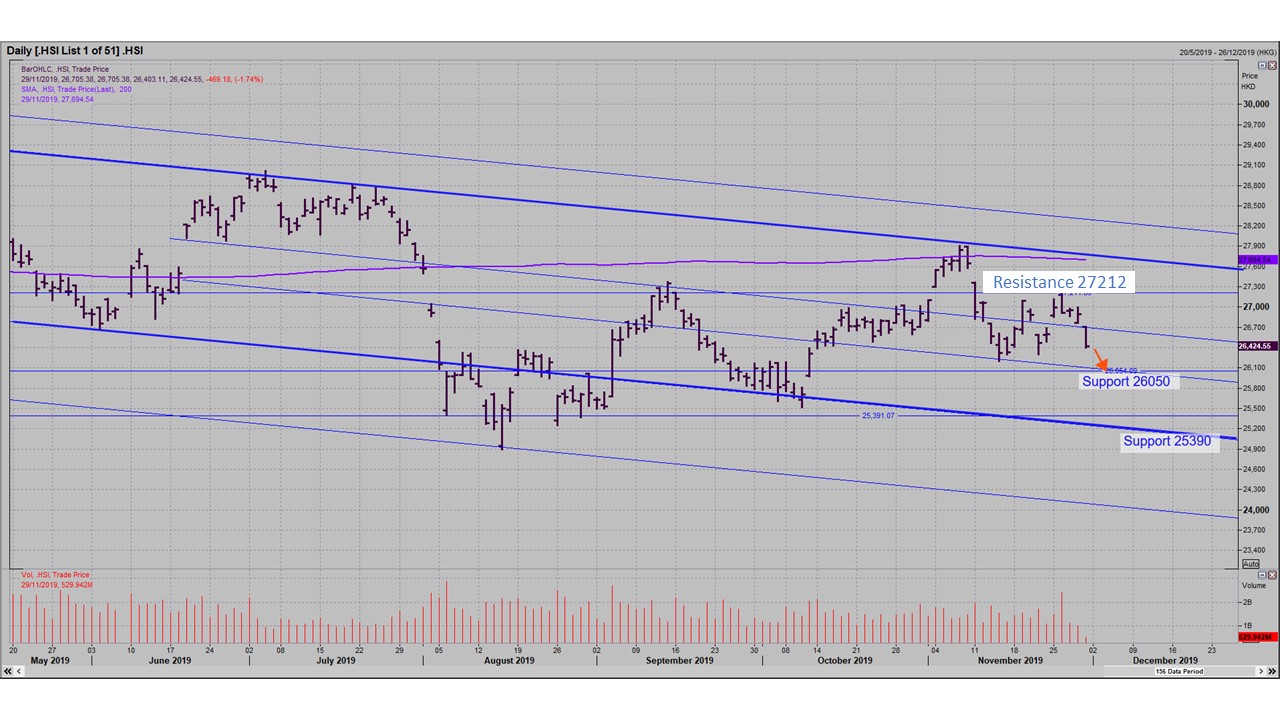
  • A corrective pullback is underway after bouncing off the November highs. Current resistance is capped at 7212.
  • The short-term price action indicates a pullback to 26050 which coincides with the support on the long-term uptrend.
  • A break below the 26000 to 26050 range would be bearish and would bring our attention to the next support at 25390.
All posts and charts are for educational and illustration purposes only

Straits Times Index – Losing Steam

  • The FTSE STI is unable to hold above the 200-day moving average support and is showing sign of reversal to test the next support at 3142. A break below 3142 could trigger a test of the next support at 3090.
  • The STI currently sits below the 200 days MA but is above its long-term trend line support. A break below the long-term trendline support could result in prolong weakness of the index.
  • The resistance is capped at 3227.
All posts and charts are for educational and illustration purposes only
Wednesday, November 27, 2019
Thursday, November 14, 2019

Breadtalk - Sign of Life


All posts and charts are for educational and illustration purposes only
Thursday, November 7, 2019

Yangzijiang - Bearish Price Action

On 5th November, it was ramped up on high volume, giving the impression that the stock has finally turned around after a period of consolidation. Today, the stock reversed to give up almost all its gains. Many traders were caught on 5th November and it will take many more days before the stock can turn up again. It could test the last support 0.95 in the short term. A break below 0.94 could see the stock price testing its low at 0.91 again.


All posts and charts are for educational and illustration purposes only
Monday, November 4, 2019

China Everbright - More Upside Ahead In The Short Term

China Everbright (CEWL.SI)

A unusual huge volume spike today could be an indication the stock had bottomed after a prolong downtrend . Next target is at 0.345 and 0.375.
All posts and charts are for educational and illustration purposes only
Friday, November 1, 2019

Hang Seng Index - Hesitating at the downtrend resistance line

Hang Seng Index  - Continues to hesitate below the resistance provided by the blue downtrend line. This price action is consistent in the last 6 months with the lower highs established . Its is testing the 100 days Moving Average (MA) and supported by the 50 days MA currently at 26315. The risk remains on the downside  until the index breaks convincely above the downtrend line.
However, if it breaks above 27150 it could close the gap to reach 17512 which is also near the 200 days MA
All posts and charts are for educational and illustration purposes only
Wednesday, October 30, 2019

DBS - Near Term Target Hit

Update to blog post on 24 Oct 2019.

Yesterday, DBS hit our target published on 24 Oct 2019. Today it continued to trend higher before being resisted at the channel line according to the trade plan!


All posts and charts are for educational and illustration purposes only

Wait Till the Midnight Hour

Here is a prolonged puzzle. Over the last quarter-century, trading during market hours in the U.S. stock market has lost money. This is true even though the stock market as a whole has, as we know, risen impressively over that period.

The reason for this is that almost all the price action happens at the open. This chart from Ned Davis Research Inc. shows the phenomenon clearly enough. Davis refers to it as the “Goodnight Moon trade.” The black line is what you would make if you bought at each day’s closing price, and sold immediately after the following day’s opening. The red line is how you fared trading at all other times during the day.

Source: Bloomberg


All posts and charts are for educational and illustration purposes only
Thursday, October 24, 2019

DBS - Bullish Breakout Day!

DBS - Bullish Breakout day breaking above the long term downtrend channel and rebounding off the 50 days Moving Average. Near term target 25.40
All posts and charts are for educational and illustration purposes only
Wednesday, October 9, 2019

2 Death Crosses on Dow Transportation Index - Could History Repeat?

During the Global Financial Crisis in 2008, the stock market crashed after the occurrence of 2 death crosses on the Dow Transportation Index.

We just saw the second death cross on the Dow Transport index in 2019, will history repeat itself?


All posts and charts are for educational and illustration purposes only
Tuesday, October 8, 2019

SGX Lunch Time Seminar


Date
Monday, 14 October 2019

Time
12.30pm - 1.30pm

Venue
SGX Auditorium, Level 2
SGX Centre 1, 2 Sherton Way
Singapore 068804

RSVP
Admission is free but pre-registration is required


Click here to register.


Enquiries
Tel: +65 6327 5438 
(Operating Hours: 9.00am - 5.00pm)


Have you always wanted to learn the ropes and skills needed to become a successful active trader?

Introducing Live Trading Hour, a session that enables you to learn from a different professional trader each week as they demonstrate trade plans for the upcoming week and show you ways to express your trading views with popular SG and HK stocks.

In this seminar, Robin will be covering the following market events, and how they can affect your trading plans:

1. High level US-China trade talk is scheduled in Oct, how do traders view this upcoming trade negotiation?

2. The landmark 70th National Day is coming in China, how will the market there react after this?

3. Gold recorded a 22% gain YTD, is there more upside for this commodity?

Join us in this session to learn more.

We look forward to your participation!


Speaker's Biography

Robin Ho

Trading Representative, PhillipCapital

Robin Ho is a top tier Trader and Remisier with PhillipCapital, and is one of Phillip's most active and successful trader. Having been through the peaks and troughs of the volatile markets, Robin is a well-sought after speaker who shares his in-depth trading knowledge with traders and investors at numerous investment seminars.

Robin has taught and mentored thousands of professional traders. He has developed his own proprietary trading system that focuses on Price Action which he believes is the answer to the volatile market today. He believes that many traders fail today because they have been employing long term and traditional indicators to short term trading, and to achieve trading mastery traders must understand market behaviour and develop a trading strategy that fits the trader's profile.
All posts and charts are for educational and illustration purposes only
Monday, October 7, 2019

Testimonial for Robin's course, September 2019

Graduates of Robin's trading course, September 2019

Testimonial from Vincent, graduate of Robin's trading course: 

"With the knowledge gained in the course I can better time my entry and exit points.I learned to analyse trends and have a clearer view of the market.Previously, I only did long trades. After attending the course I learned practical strategies for short trades as well. The course is special as we were analysing a common portfolio over six lessons and we could see how the charts evolved according to the trade plans we prepared.We saw how the technical skills and knowledge taught in the class came into play in the live trading session. Now I have a better feeling of what traders do on a daily basis."


All posts and charts are for educational and illustration purposes only
Saturday, October 5, 2019

Jinxin Fertility 1951.hk - Next Move Upwards Is On The Cards

Jinxin Fertility 1951.HK -  The Next Push Upwards Is On The Cards.
A niche business in the healthcare industry  providing assisted reproductive services such as vitro fertilisation treatment. In 1H19 it booked revenue of Rmb 791.1m, with adjusted net profit of Rmb 256m, representing a 102% increase.

On the chart , the price action is indicating the BB are accumulating the stock after it broke  above its IPO debut high on 8 Sep. This consolidation phase are about to result in a push upwards  to test its Sep high at 12.80.  This blog expect this stock to break above 12.80 that we pave the way to  its next price objective at 13.60 soon.
All posts and charts are for educational and illustration purposes only
Friday, September 20, 2019

Yangzijiang - The Big Boys Could Have Distributed

Yangzijiang - Great rebound could have ended . Could have peaked at 1.11. There are technical sign of BB distributioning betwen1.08-1.10. The share price is currently capped at the 1.08 resistance. Could be heading for the next target at 0.99, 0.95 and 0.90.
All posts and charts are for educational and illustration purposes only
Friday, September 6, 2019

The Trade War Cycle

Since Trump became President he has said for 14 times that US is close to a deal with China but the deal has never materialised. In spite of being played out so many times, traders continue to believe in what Trump says. This is the trade war trading cycle. Every trader gets sucked into this cycle of death.


All posts and charts are for educational and illustration purposes only
Wednesday, August 28, 2019

Gold Glitters - Why it will be the Best Performing asset class this year

According to Deutsche Bank about 15 % of the government bonds globally trades at negative yield, many investors who shunned  gold because of its zero yield does not consider it as a penalty now. Its unthinkable that Government are getting paid to borrow money as people seek for a safe haven to park their money as trade tension and volatility rise, its no surprise that people are flocking to Gold.

Another compelling reason that make Gold a natural investment choice is central bankers around the world competes in a monetary race to bring rates to zero. Fed cuts interest rates from 2.5 to 2.25% last month and this marked the central bank's first rate cut since 2008. Recently New Zealand, Thailand and India followed in the wake of the Fed to cut rates.

As interest rates worldwide goes negative, investors suffers less opportunity cost from  gold's zero yield. Gold is traditionally  an inflation hedge and its appeal as a stored value is back again.

This blog has been predicting Gold will be the top investment asset class since 23 Mar 2019 when Gold was trading at 1310 and thus far it has hit my first target at 1550. Gold is poised to test its 2011 high of 1915 this year.

On the Chart, this is my outlook and where Gold stands now
All posts and charts are for educational and illustration purposes only
Sunday, August 18, 2019

Robin Ho At Spore InvestFair 2019

I will be speaking at Spore Investment Fair 2019 on Sunday 12.00. Hope to catch some of you there!
All posts and charts are for educational and illustration purposes only
Monday, August 12, 2019

The Giant Hunt For Yield Will Lead To A Financial Melt Down


The Giant  Hunt For Yield Will Lead To A Financial Melt Down
The US 10 Years Treasury yield is poised to test the 6 years low at 1.35% as negative bond yields wash over Europe and Japan. This will force  the Fed to keep lowering rates so that America can remain competitive with the rest of the world. Investors and corporation will be force and lured into taking riskier bets and anything that provides some sort of decent cash flows will be bought up, as American yields head lower and lower. The elusive inflation,  that central bankers hope will rise to ease the global debts problem has not materialize inspite of prolonged monetary stimulus. The build up in risky asset and debts will eventually lead to a Big Blow up. The only safe haven this blog believe is in Gold.

All posts and charts are for educational and illustration purposes only
Tuesday, August 6, 2019

China Yuan Devaluation and Its Impact

China’s currency broke through the psychologically important level of 7 yuan to the dollar, prompting President Trump to accuse Beijing of manipulating its currency .

PBoC said the currency’s slump was “due to the effects of unilateralist and trade-protectionist measures and the expectations for tariffs against China,” the People’s Bank of China said in a statement.

Currency weakness is a textbook response to tariffs being imposed on a country’s exports but do not expect a repeat of Monday’s large one-day depreciation because devaluation will hurt both countries as imports becomes more expensive for chinese companies.

Monday’s move should be seen as a warning shot , its more likely the PBoC will be to allow a gradual (2018-style) depreciation in response to the heightened tariff threat given that global trade and manufacturing are already considerably weaker than a year ago.

The other smaller Asian currencies will also weaken in the wake of the yuan . The weakening of the yuan will be also post as a tailwind for commodity prices Historically, turning points in the CNY/USD exchange rate have also coincided with turning points in commodity prices. This blog expect commodity prices to be soft going forward to the end of the year.
All posts and charts are for educational and illustration purposes only

Robin Ho's Live Trading Bootcamp

I will be conducting a live trading boot camp on National Day, 9 August 2019 at One Good Trade Cafe. 

The cafe can accommodate 30 participants, and registration is on a first-come-first-serve basis. Join me if you are free!

Registration and details here:


About One Good Trade Cafe / Menu for the Day

One Good Trade Cafe is a social networking platform for traders & investors. Come enjoy great coffee with like-minded people or chill with a beer, wine or cocktail with bar bites and all-day dining.

Your meals are covered for the day! Enjoy the sumptuous signature meals at One Good Trade Cafe while you learn. Here are your meal options (please indicate your meal preference as you checkout).
All posts and charts are for educational and illustration purposes only
Monday, August 5, 2019

Market Outlook 3Q 2019 - Slides Download

We had a fruitful market outlook seminar on Saturday! More than 400 participants gathered at Nexus auditorium as I shared on the new global trends and stock trading ideas, particularly what a smart investor will do in the new digital age and the low inflation and low interest environment.


If you have missed the seminar, you may download selected slides for more trading ideas: Click here to download slides

Please join us for the next Market Outlook and take advantage of the super early bird promotion (last few days): Click here to register

Next Market Outlook

14 Dec 2019, Saturday
930am - 1230pm

Cuppage Plaza
5 Keok Road #05-07
Singapore 228796


My upcoming Master the Markets trading course with Cyberquote is scheduled in October 2019.

In this course, the class will monitor and trade a portfolio together with me over a 3 week period. Join me for a hands-on, practical experience in trading!

Send your queries to: robinhosa@phillip.com.sg cc: tanyunyou@phillip.com.sg.


All posts and charts are for educational and illustration purposes only
Thursday, July 18, 2019

FANG INDEX - Early Sign Of A Breakdown. Chart Point Target Reached .

FANG INDEX - Early sign of a Chart breakdown . The long term target at  293 has been hit . A
double top reversal pattern could be forming. A break below 280 could trigger a downward aceleration to 255. The index tracks the performance of Fang stocks along with several other high growth technology shares like Nvidia , Baidu and Tesla.
All posts and charts are for educational and illustration purposes only
Tuesday, July 9, 2019

S&P 500 - topping out

S&P 500 is forming a topping out pattern, which could lead to significant decline.


All posts and charts are for educational and illustration purposes only
Friday, June 28, 2019

Y Venture - Today's Price Action Could Indicate That The Big Boys Have Distributed !


Y Venture - Today's Price Action Could Indicate That The Big Boys Could Have Distributed at 0.15. A break below 0.14 support will bring the stock to  0.132, 0.12 and 0.101


All posts and charts are for educational and illustration purposes only
Tuesday, June 25, 2019

Four Signs the Gold Bull is Back

Gold break out of 6 years downtrend. I have called a buy on Gold since my market outlook on 23 mar when gold prices was at 1315. Back then the call to overweight on gold was the bearish outlook for the US dollar, the impending recession due to the inverted yield curve and the expectation of the central bankers reverting to another monetary stimulus in the form of modern monetary theory if recession sets in.
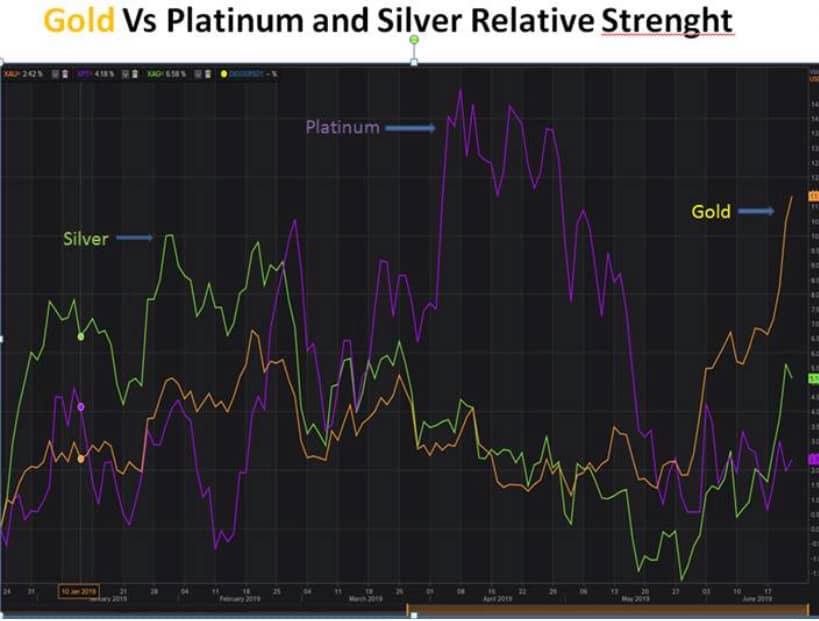
I see 4 signs why the gold bull run is back. First, despite a strong dollar gold was quickly closing in on multi year highs. Second, and perhaps more important, gold mining stocks are outperforming Gold for the first time in many years. This is evident in the Gold ratio index. Because gold stocks provide leverage to the price of gold, they tend to move faster than gold if it is a real bull run. Thirdly Gold is also outperforming the other precious metal like silver and platinum. Fourthly. the world’s biggest central bankers are all preparing to flood the world with “easy money” again and add in the rising Middle East tension and your can expect a explosive move higher.


All posts and charts are for educational and illustration purposes only
Thursday, June 13, 2019

HK Extradition bill could inflict huge damage on HK economy and stock market

The passage of the extradition bill could be a tipping point for the removal of US-Hong Kong Policy Act which can potentially inflict huge damage on the Hong Kong economy and its stock market

The passage of the extradition bill could potentially be the tipping point in US-Hong Kong relations, from which the US begins to seriously question whether Hong Kong is justified to receive special treatment from the US.

The US is also concerned that the proposed changes “could create serious risks for US national security and economic interests in the territory. If passed, the bill could potentially violate several key provisions of the US-Hong Kong Policy Act of 1992” “ and subject US citizens residing in or visiting Hong Kong to China’s judicial system.

There are fears the US will revoke the US-Hong Kong Policy Act. The policy act treats Hong Kong as a separate jurisdiction from mainland China and gives Hong Kong special treatment with regards to matters trade and commerce . For example, Hong Kong is not subject to the tariffs imposed by the US on Chinese goods in the current trade war.

I believe that the risk of the US withdrawing the US-Hong Kong Policy Act immediately is small since Donald Trump has not sound any serious opposition so far . Removal of the US-Hk Policy act could also set off the withdrawal of foreign investment in Hong Kong businesses and asset from a loss of confidence.
All posts and charts are for educational and illustration purposes only