Wednesday, March 23, 2022

BABA (HKEx:9988) Hit Trend Channel Resistance, Could Pull Back.

Alibaba has hit short-term trend channel resistance today at 117.60 HKD.

Could correct to support levels of 114.15, 109.13 and 104.41 in the short term. 


All posts and charts are for educational and illustration purposes only
Tuesday, March 22, 2022

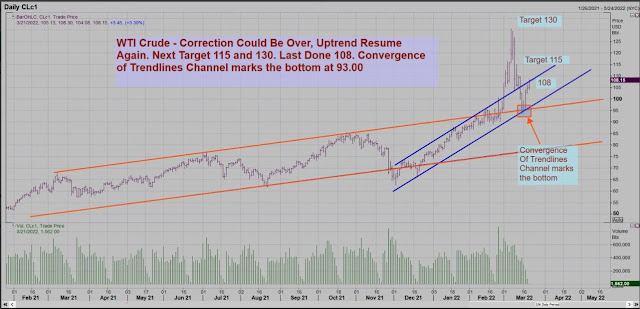
WTI Crude Correction Could Be Over, Uptrend To Resume

Yesterday, I posted my trade plan on WTI Crude Oil in my Telegram Stock Chat Group when WTI crude was at 108.

Today, WTI Crude futures surged to high of 115 (up more than 2%) hitting my first target . The correction for crude could be over, and it’s poised to challenge the last high at 130.


When WTI crude corrected from 130 to 93, a lot of traders shorted the crude with a view that it had peaked . If the prices challenge the 125 mark it could trigger massive short covering that will take WTI crude to 147. 


All posts and charts are for educational and illustration purposes only
Wednesday, March 16, 2022

ISDN (SGX: I07) Bearish Price Action - H&S Formed With 50-MA broken)

ISDN form head and shoulder pattern last November. The stock continued to trade weaker thereon and broke below its 50 day-MA in Feb 2022. ISDN price is on a downtrend since.

The stock last traded at 0.575
Immediate Resistance: 0.615
Second Resistance: 0.715
Cut Loss: Above 0.74
Target 1: 0.535
Target 2: 0.45

Target 3: 0.385


All posts and charts are for educational and illustration purposes only
Friday, March 11, 2022

How RHO Trade Plan correctly call a sell on DBS (SGX: D05) near its peak and took profit close to the recent bottom.

DBS hit a peak at 37.49 on 14 February.
RHO Trade Plan identified the start of a downtrend on 25 February and a short call was made at 34.95.
Using RHO propriety price action strategy, we identified our profit targets and cut loss levels. They were spot on, with DBS hitting three out of the four targets set out in the trade plan (gaining more than 11% in slightly more than 1 week).
What’s more? When the third target at 31.05 was hit, DBS pull off a sharp rebound, and we then took all our profit.
In a volatile market like this, it’s so important to understand how to create a good trade plan to identify precisely when to enter and exit your trade.
To find out more about Robin’s proprietary trading strategy, email tanyunyou@phillip.com.sg.
To get first insight into Robin’s trading idea and live market analysis join RHO live-stock chat group. Email Robin at robinhosa@phillip.com.sg.
For account opening, you can click on the link provided: https://blog.robinhosmartrade.com/.../join-robins-trading...


All posts and charts are for educational and illustration purposes only
Monday, March 7, 2022

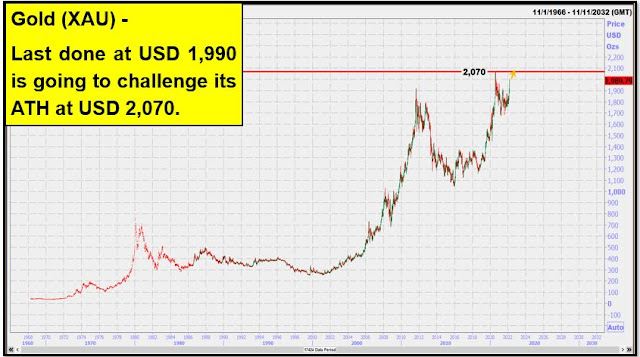
Gold last done at USD 1,990 is going to challenge its ATH at USD 2,070.

These are the reasons:

* Gold is both a safe haven asset and an inflation hedge. We are in the middle of these conditions.
* War is defining movement throughout financial markets
* Inflation is a big concern. War stoking prices.
* Gold has been largely ignored during wider pandemic driven commodity gains.


All posts and charts are for educational and illustration purposes only

WTI Crude is heading for all-time high at USD 147.

Russia is the world’s largest exporter of oil to global markets and the second largest crude oil exporter behind Saudi Arabia. US and it’s European allies are mulling over the imposing sanctions on Russian oil .
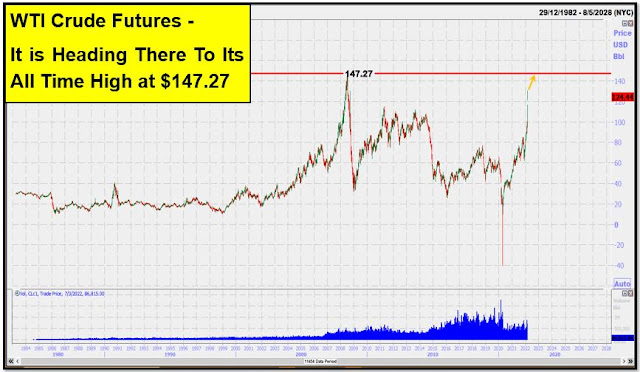
If it happens , oil will sky rocket above is ATH as the sanction could exacerbate the current tight supply conditions.
Furthermore, OPEC Plus declined to take steps to cool the market at their recent meeting while Russia’s invasion of Ukraine rattles markets sends the price of crude skyrocketing.
What seems to be a ray of hope to the Iran Nuclear deal , after months of negotiations , a revised deal was expected to be reached within days under which US sanctions would be lifted in return for Tehran returning to full compliance with the 2015 nuclear nonproliferation deal.
But diplomatic efforts have been sent into a tailspin by Russia’s unexpected demand for written guarantees that its economic trade with Iran will be exempted from US sanctions imposed on Russia since its invasion of Ukraine.
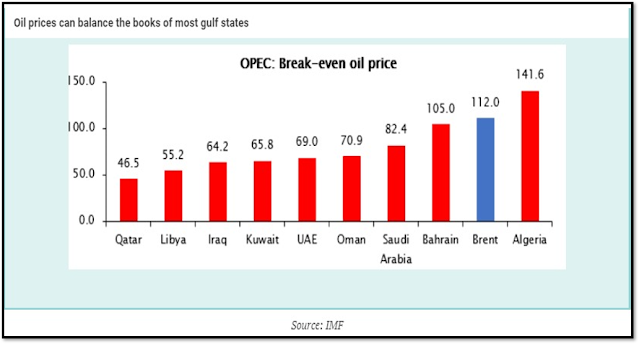
Gulf states sees constraint supply with soaring prices as an as an opportunity to balance their books which potentially could send Crude Oil futures surging towards their all-time high at $147.


All posts and charts are for educational and illustration purposes only
Thursday, March 3, 2022

Commodity Supercycle is Accelerating Higher

 The Bloomberg Commodity Index broke out from its uptrend channel to hit a 124 high today.

The 1st target at 131 is approaching but before the year end it should hit 175. Stay invested in commodity stocks especially crude oil.


All posts and charts are for educational and illustration purposes only
Friday, February 25, 2022

It’s Time To Take Profits on Singapore Banks.

Singapore banking stocks opened lower on Thursday (Feb 24), in view of extending losses on Wall Street amid Russia and Ukraine confrontation.


The recent results of Singapore banks have not been fantastic, with both DBS and OCBC bank missing analysts’ expectations.

DBS (SGX: D05)DBS Earnings Miss Forecasts Despite Plunging Allowances
DBS Group recent results showed its net profit for the fourth quarter grew 37 percent from a year earlier to S$1.39 billion, missing a forecast from a Reuters poll of four analysts.

The miss came despite total allowances tumbling after repayments of what the bank called two significant non-performing loans in the quarter.

But all of that wasn’t enough to overcome the negative impact of interest rate cuts early in the pandemic and the exceptional investment gains afterward when markets posted a stunning recovery.

Source: Finews.asia, Smartkarma

DBS (SGX: D05) exhibited technical breakdown yesterday (24 Feb 2022) after a 3-month uptrend (establish since end of Nov 21), the uptrend channel line has been broken and the stock is exhibiting a technical breakdown yesterday (24 Feb 2022).
Resistance is capped at 36.50, could correct to 33.81 and 32.70 in the short term from its current price of 34.95 (at the point of this write up), if weakness persist the stock could correct back to 31.05 and 29.87 in the longer term.
Cut loss above 36.50.


OCBC (SGX: O39) - Another Weak Print
OCBC reported 4Q21 net profit of SGD 973 million, an SGD 251 million (20.5%) decrease on a linked quarter basis.

If not for the 51.8% decline in Singapore not performing loans (NPLs), credit quality would have been disastrous for OCBC, reserves would appear to now be waning by more than SGD 2.8 billion or nearly three quarters of bottom-line results.

Source: Finews.asia, Smartkarma

OCBC (SGX: O39) similar to DBS exhibited bearish price action yesterday (24 Feb 2022) , after a 3-month uptrend (established since end of Nov 21), the uptrend channel line was broken upon their results announcement (23 Feb) and the stock is exhibiting further short-term bearish price action yesterday when it broke the 12.38 support level.

Resistance is capped at 12.69, could correct to support levels of 11.70, 11.38 and 10.98 in the short term from its current price of 11.92.

Cut loss above 12.69.


All posts and charts are for educational and illustration purposes only
Tuesday, February 22, 2022

Bloomberg Commodity Index - The Commodity Super Cycle Uptrend in full swing.

Conviction buy call to signal the start of the multiyear bull run was made on 18 Feb 2021. The index has gone up 100% but the bull is still young. Next target 115 and 135.


All posts and charts are for educational and illustration purposes only

Crude oil prices looks set to hit 100 and the commodity index will continue to charge ahead.

Russia is world top wheat producer and Ukraine is world 3rd largest producer of corn and 4th largest producer of wheat.


All posts and charts are for educational and illustration purposes only
Friday, February 18, 2022

Alibaba (9988 HK, NYSE: BABA) will be posting their results on 24 Feb 2022 (next Thursday). What are the street expectations? What do the analysts say?

Optimistic Analysts: Overly Impacted, Accumulate Before 3Q22 Result
Alibaba shares at current price is trading at 2017 price levels even though their revenue grew 5.5 times of that in 2017. Optimistic Analysts believe that Alibaba's current P/E for Fiscal 2022 (ending March 2022) at 15.9x is trading twice lower than the average P/E from 2017 to date at 31.3x.
Another more conservative method in valuing Alibaba shares to measure Alibaba’s P/E average before the pandemic (from Alibaba’s IPO to 2019) at 26.9x which is 68.5% higher than the P/E 2022.
As such, using the above valuation matrix above, Optimistic Analysts believe that the correction in Alibaba shares is over with a 68% upside potential target price of US$206.
In addition, they expect Alibaba’s revenue to grow 14% YoY in Q3, 2022 and 22% YoY for FY2022 with operating margin to stabilise (between 22.4-22.6%) over the next two years, as the group continues to dispose non-profitable business (i.e. Possibility to sell part of their media holdings Weibo Corp (HKEx: 9898, Nasdaq: WB)).
Pessimistic Analysts: But, The Street's Most Pessimistic Forecasts on Alibaba Have Been Right
Pessimistic analysts view that Alibaba average consensus price targets (PT) have often been "too optimistic" over the past three years. It seems that BABA stock has trended closer to its most pessimistic price targets (PT), notably since BABA stock's November 2020 peak. Moreover, Alibaba's PT has also been revised downwards consistently, as its fundamentals have gotten worse as China's economy continues to slow.
In addition, Alibaba's reducing margins and investments in lower margins businesses have contributed to their consistent deterioration and diluted margins over the last three years.
Amid macroeconomic impact from China's slowing growth coupled with the need for more aggressive investments to fend off competition and develop new long-term growth drivers, pessimistic analysts believe that Alibaba lack a near term catalyst and there aren't enough near-term catalysts to turn more positive over its medium-term outlook yet. They believe that there is still a period of digestion for Alibaba until its revenue estimates reach a bottom.
They think it could come nearer to the end of 2022, as certain macro headwinds could start to unwind. These include the supply chain disruption and regulatory clarity.
The most pessimistic PT for BABA stock is $140, representing a 14.5% implied upside.
But, if you take a meaningful discount to account for Alibaba stock headwinds, then it's at most fairly valued, if not overvalued.
Therefore, pessimistic analysts encourage investors to remain patient for more data points before jumping into Alibaba stock again.
Moreover, the growth stocks correction in the US market has presented a plethora of alternative opportunities to consider. So, they believe that there's no need to rush into Alibaba stock for now.
Source: Smartkarma/Seeking Alpha

(Disclaimer: the above is for informational purposes subject to errors and omissions, and does not constitute an offer to sell or a solicitation of an offer to purchase any financial instrument.) 

All posts and charts are for educational and illustration purposes only
Thursday, February 10, 2022

US Dollar Index - One Year Rally Could Be Over!

Macro Trend Cycle was hit at 94.5, get set for the down trend cycle which will see dollar crash to 92.00.


All posts and charts are for educational and illustration purposes only
Thursday, December 23, 2021

JD.com drop 9pct - time to accumulate ?

Tencent Holdings “send Christmas gifts” to shareholders as it announced it will distribute the JD Group’s class A ordinary shares to share holders in kind as a interim dividend. JD.com shares fell 9 pct. This is Tencent strategy to distribute dividend via JD.com shares, it does not mean that JD.com fundamentals have worsened. This distribution will bring selling pressure in the short term but it could also help expand its shareholder base thru Tencents core long term investors. After the move Walmart will be JD.com largest shareholder. 


Amongst the China internet stocks that have been plummeting this year , I actually like Jd.com. The overall crackdown on monopolistic practices by tech companies have made JD.com benefit, as the recent Single Day Sales saw JD.com dwarfed Alibaba's sales growth this year, with JD.com Singles' Day total GMV sales growth on its platform jumping 33% in 2021 compared to Alibaba’s 14%.


Even though Alibaba grew 14% sales growth of Singles Day, the growth is considered a significant slowdown compared to its 93% sales growth in the prior year.


Another driving catalyst of JD.com’s future long-term growth is the emergence of “digital yuan”. Currently there are about 300 million “unbanked” adults in China, with the digital yuan these group of people would be integrated into the digital economy. Given that an average Chinese consumer spends about US$3,000 a year on e-commerce platforms and if this people starts to spending even half of it (US$1,500), this would about US$450 billion worth of e-commerce consumption.


Accumulate JD.com  for the rebound between 236 to 247 .

All posts and charts are for educational and illustration purposes only
Monday, December 20, 2021

Russell 2000 - Is Another 2020 Covid Pandemic Style Crash Coming? The Current Price Action Is Looking Similar to The Price Action Before the Crash Happened in March 2020.

Before the last market pandemic crash in March 2020, the Russell 2000 index had been consolidating for about a year from Feb 2019 to Feb 2020 before taking the plunge in March 2020. The index suffered a 42% decline within a month’s period.


The current price action pattern seems to bear some resemblance to that of 2019, the Russell 2000 has been consolidating within the 2121 to 2173 range since February 2021, made an attempt to break out of the range in November 21 but failed and this price action is eerily similar to the pattern prior to the 2010 pandemic crash.

Recently, I have posted another bearish price action on index exhibiting a weak divergence from the Dow Jones Index.

For those with high risk tolerance, I liked the Direxion Daily Small Cap Bear 3x (TZA) – Leveraged Inverse ETF, the chart seems to be poised for a macro technical breakout. I have also been sharing this trading idea with my inner core group.

Direxion Daily Small Cap Bear 3x (TZA) – Leveraged Inverse ETF
Seek daily investment results, before fees and expenses, 300% of the inverse (or opposite), of the performance of the Russell 2000 Index.
As for those wanting to take unleveraged inverse position on Russell 2000. You could look at the RWM ETF.

Proshares Short Russell 2,000 -1x (RWM) – Unleveraged Inverse ETF
ProShares Short Russell2000 seeks daily investment results, before fees and expenses, that correspond to the inverse (-1x) of the daily performance of the Russell 2000 Index.

Chart pattern and prices action tends to repeat itself and if you believe there will be impending crash coming in the Russell 2000 index, you may look into inverse Russell 2000 ETFs that enables you to profit from the potential downside.

(Disclaimer: the above is subject to errors and omissions, please refer to actual announcement for accurate details. The above is for informational purposes and does not constitute an offer to sell or a solicitation of an offer to purchase any financial instrument.)


All posts and charts are for educational and illustration purposes only
Friday, November 26, 2021


During the recent market outlook about two weeks back, I shared an interesting phenomenon I discovered on my trade plans for Dow Jones and S & P 500. 


Both charts were pointing towards a topping out pattern, reinforcing my conviction that a major market  correction is near the horizon.


All posts and charts are for educational and illustration purposes only
Tuesday, November 23, 2021

Nasdaq 100 Could Have Topped Out at 16,764.

Yesterday's Price Reversal followed by 3 days of volume surge signals more weakness to follow.
Trade Plan:
Short below 16,380
1st Target: 16,175
2nd Target: 15,720
3rd Target: 15,250
Cut Loss: 16,820 


All posts and charts are for educational and illustration purposes only
Wednesday, October 6, 2021

Sinopec (0386.HK) set to benefit from rising energy demand.

Crude oil prices reached close to 2014 peaks after the OPEC+ group of producers stuck to its planned output increase rather than pumping even more crude on Tuesday.
Numerous natural events happening across the globe (a freak winter freeze in Texas, lightning strike in Louisiana and hurricanes along the Gulf Coast) have conspired to disrupt production and raise prices of essential chemicals.
Sinopec (0386.HK) being a crude oil and chemical producer is likely to be a beneficiary of rising crude oil and chemical prices.


The stock has since broken out from 3-Year Downtrend!
Last done at 4.06.
Next target 4.09
Second Target: 4.37
Third Target: 4.70

Stop Loss: 3.70 

All posts and charts are for educational and illustration purposes only